Led end-to-end redesign of a critical, underutilized claims and settlements workflow — streamlining compliance and rebate operations, driving enterprise adoption, and securing $3M+ ARR with $2M+ in incremental revenue.
Enable is a rebate management platform that helps companies manage complex trading partner agreements. Claims is the module where those agreements get settled — the point where money actually moves.
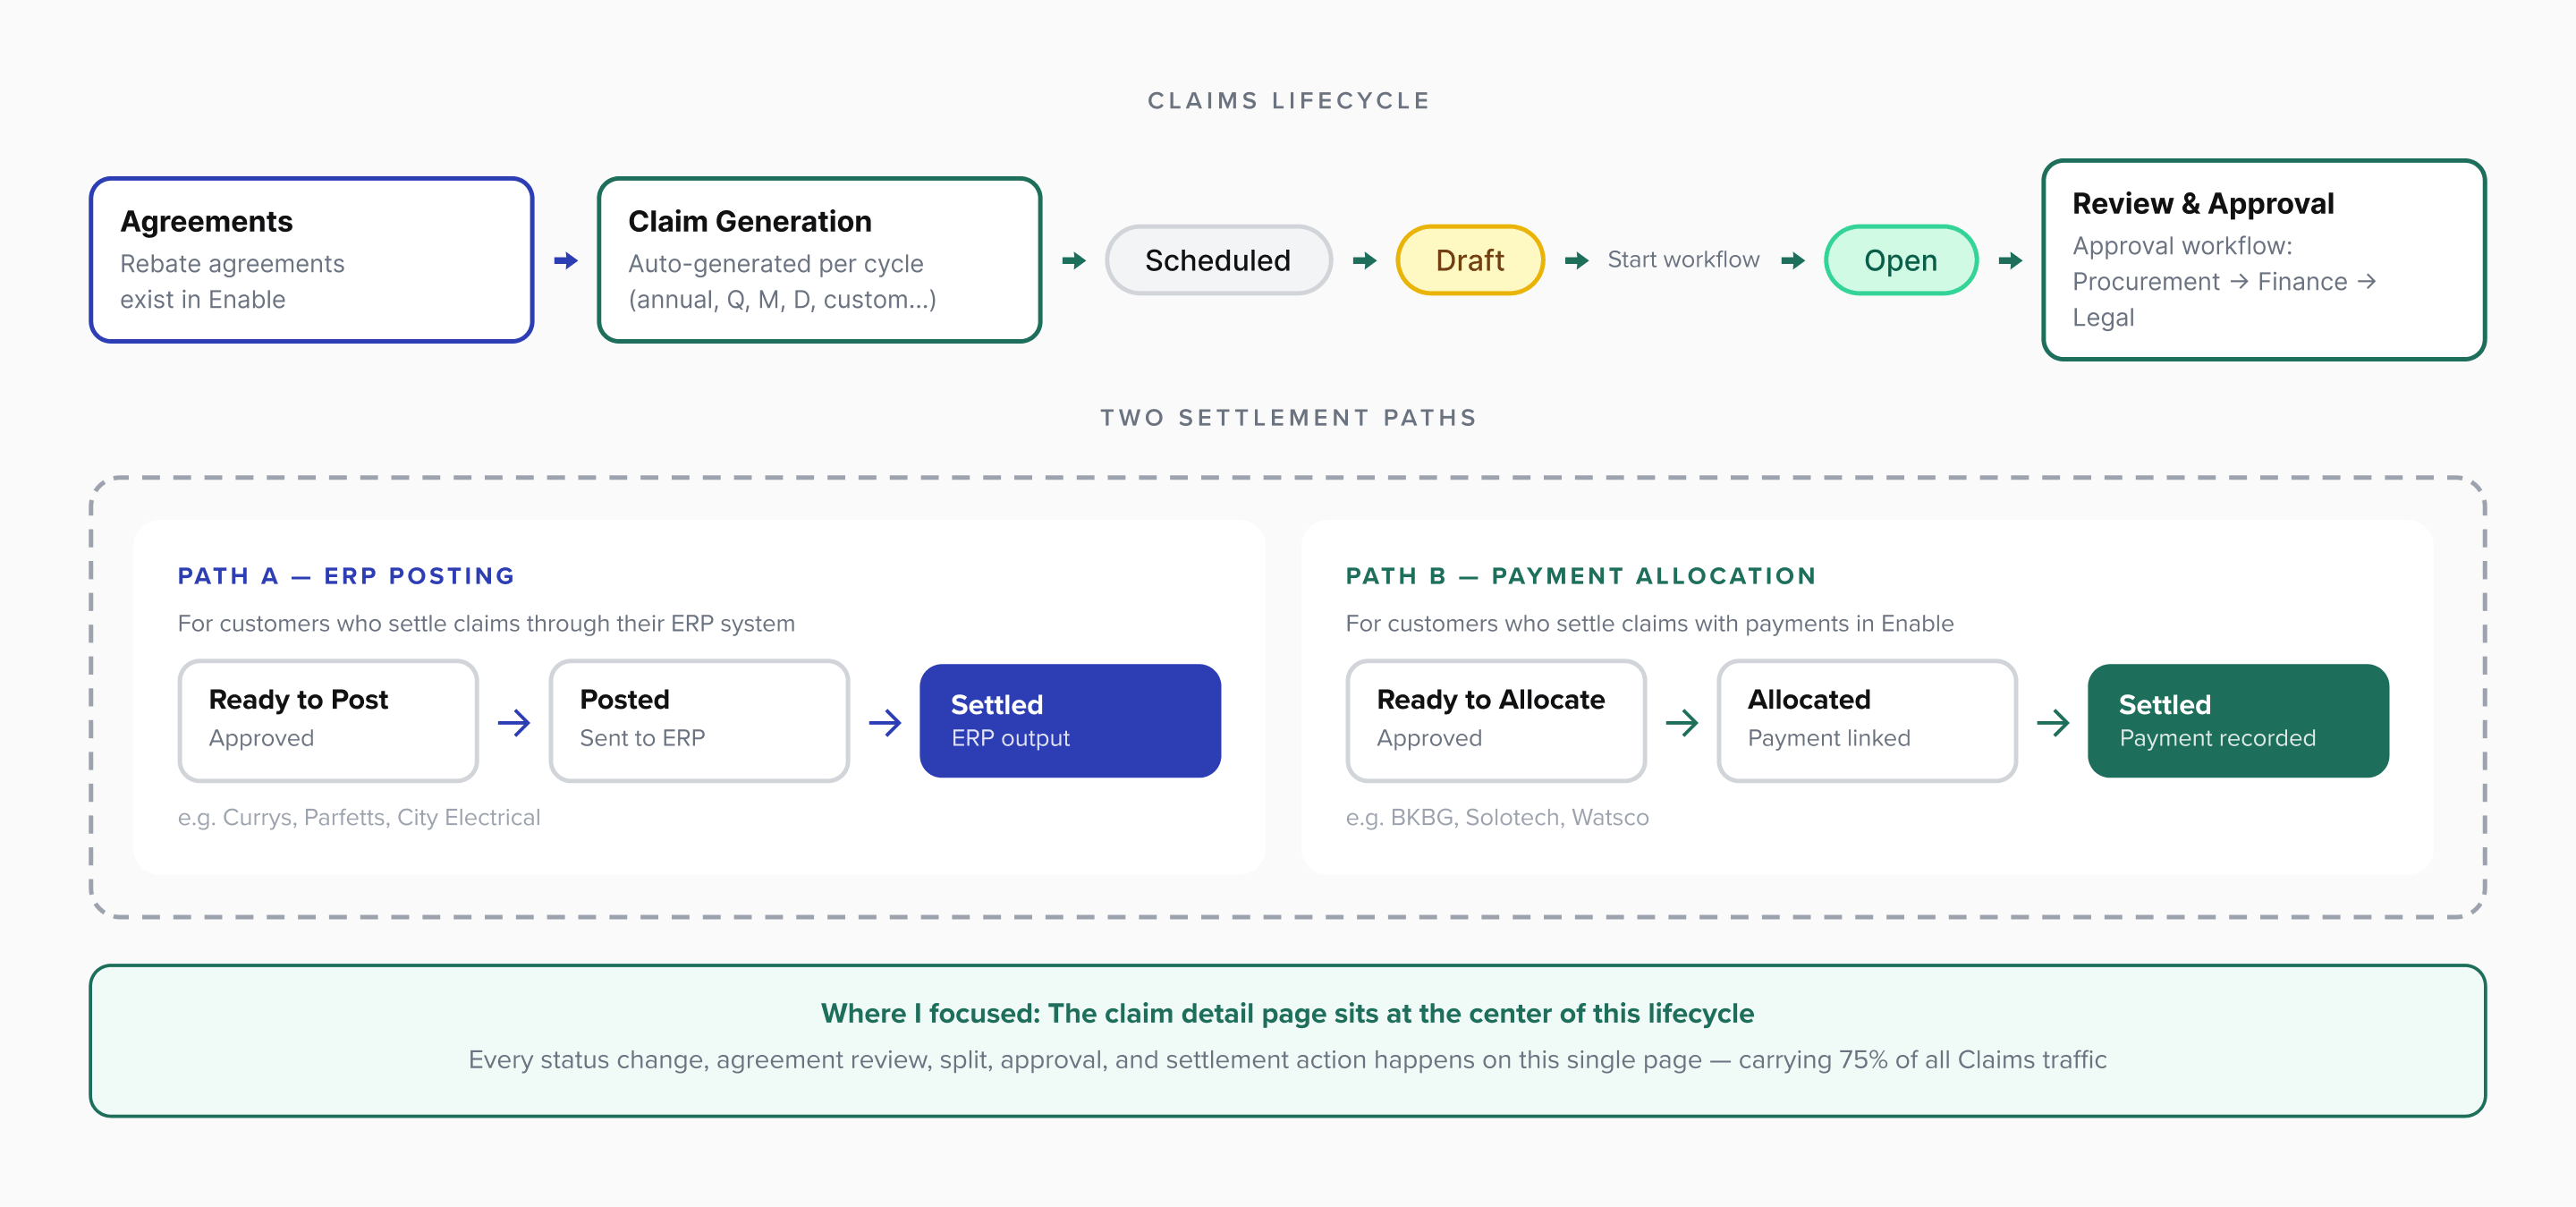
The workflow is straightforward in concept: agreements exist in Enable — at the end of each cycle (quarterly, annually, or custom), claims are auto-generated — users review and approve — approved claims either post to ERP or settle via payment within Enable.
But the reality is far more complex. Claims serves two distinct user groups with different workflows:
ERP-posting users — settle claims and output data to their ERP system (e.g., Currys, Parfetts)
Payment users — enter and allocate payments directly within Enable (e.g., BKBG, Solotech)
Customers range from single-user SMBs ($30k ARR) to strategic enterprise accounts ($1.6M ARR) with 10+ users. The product needed to work for all of them.
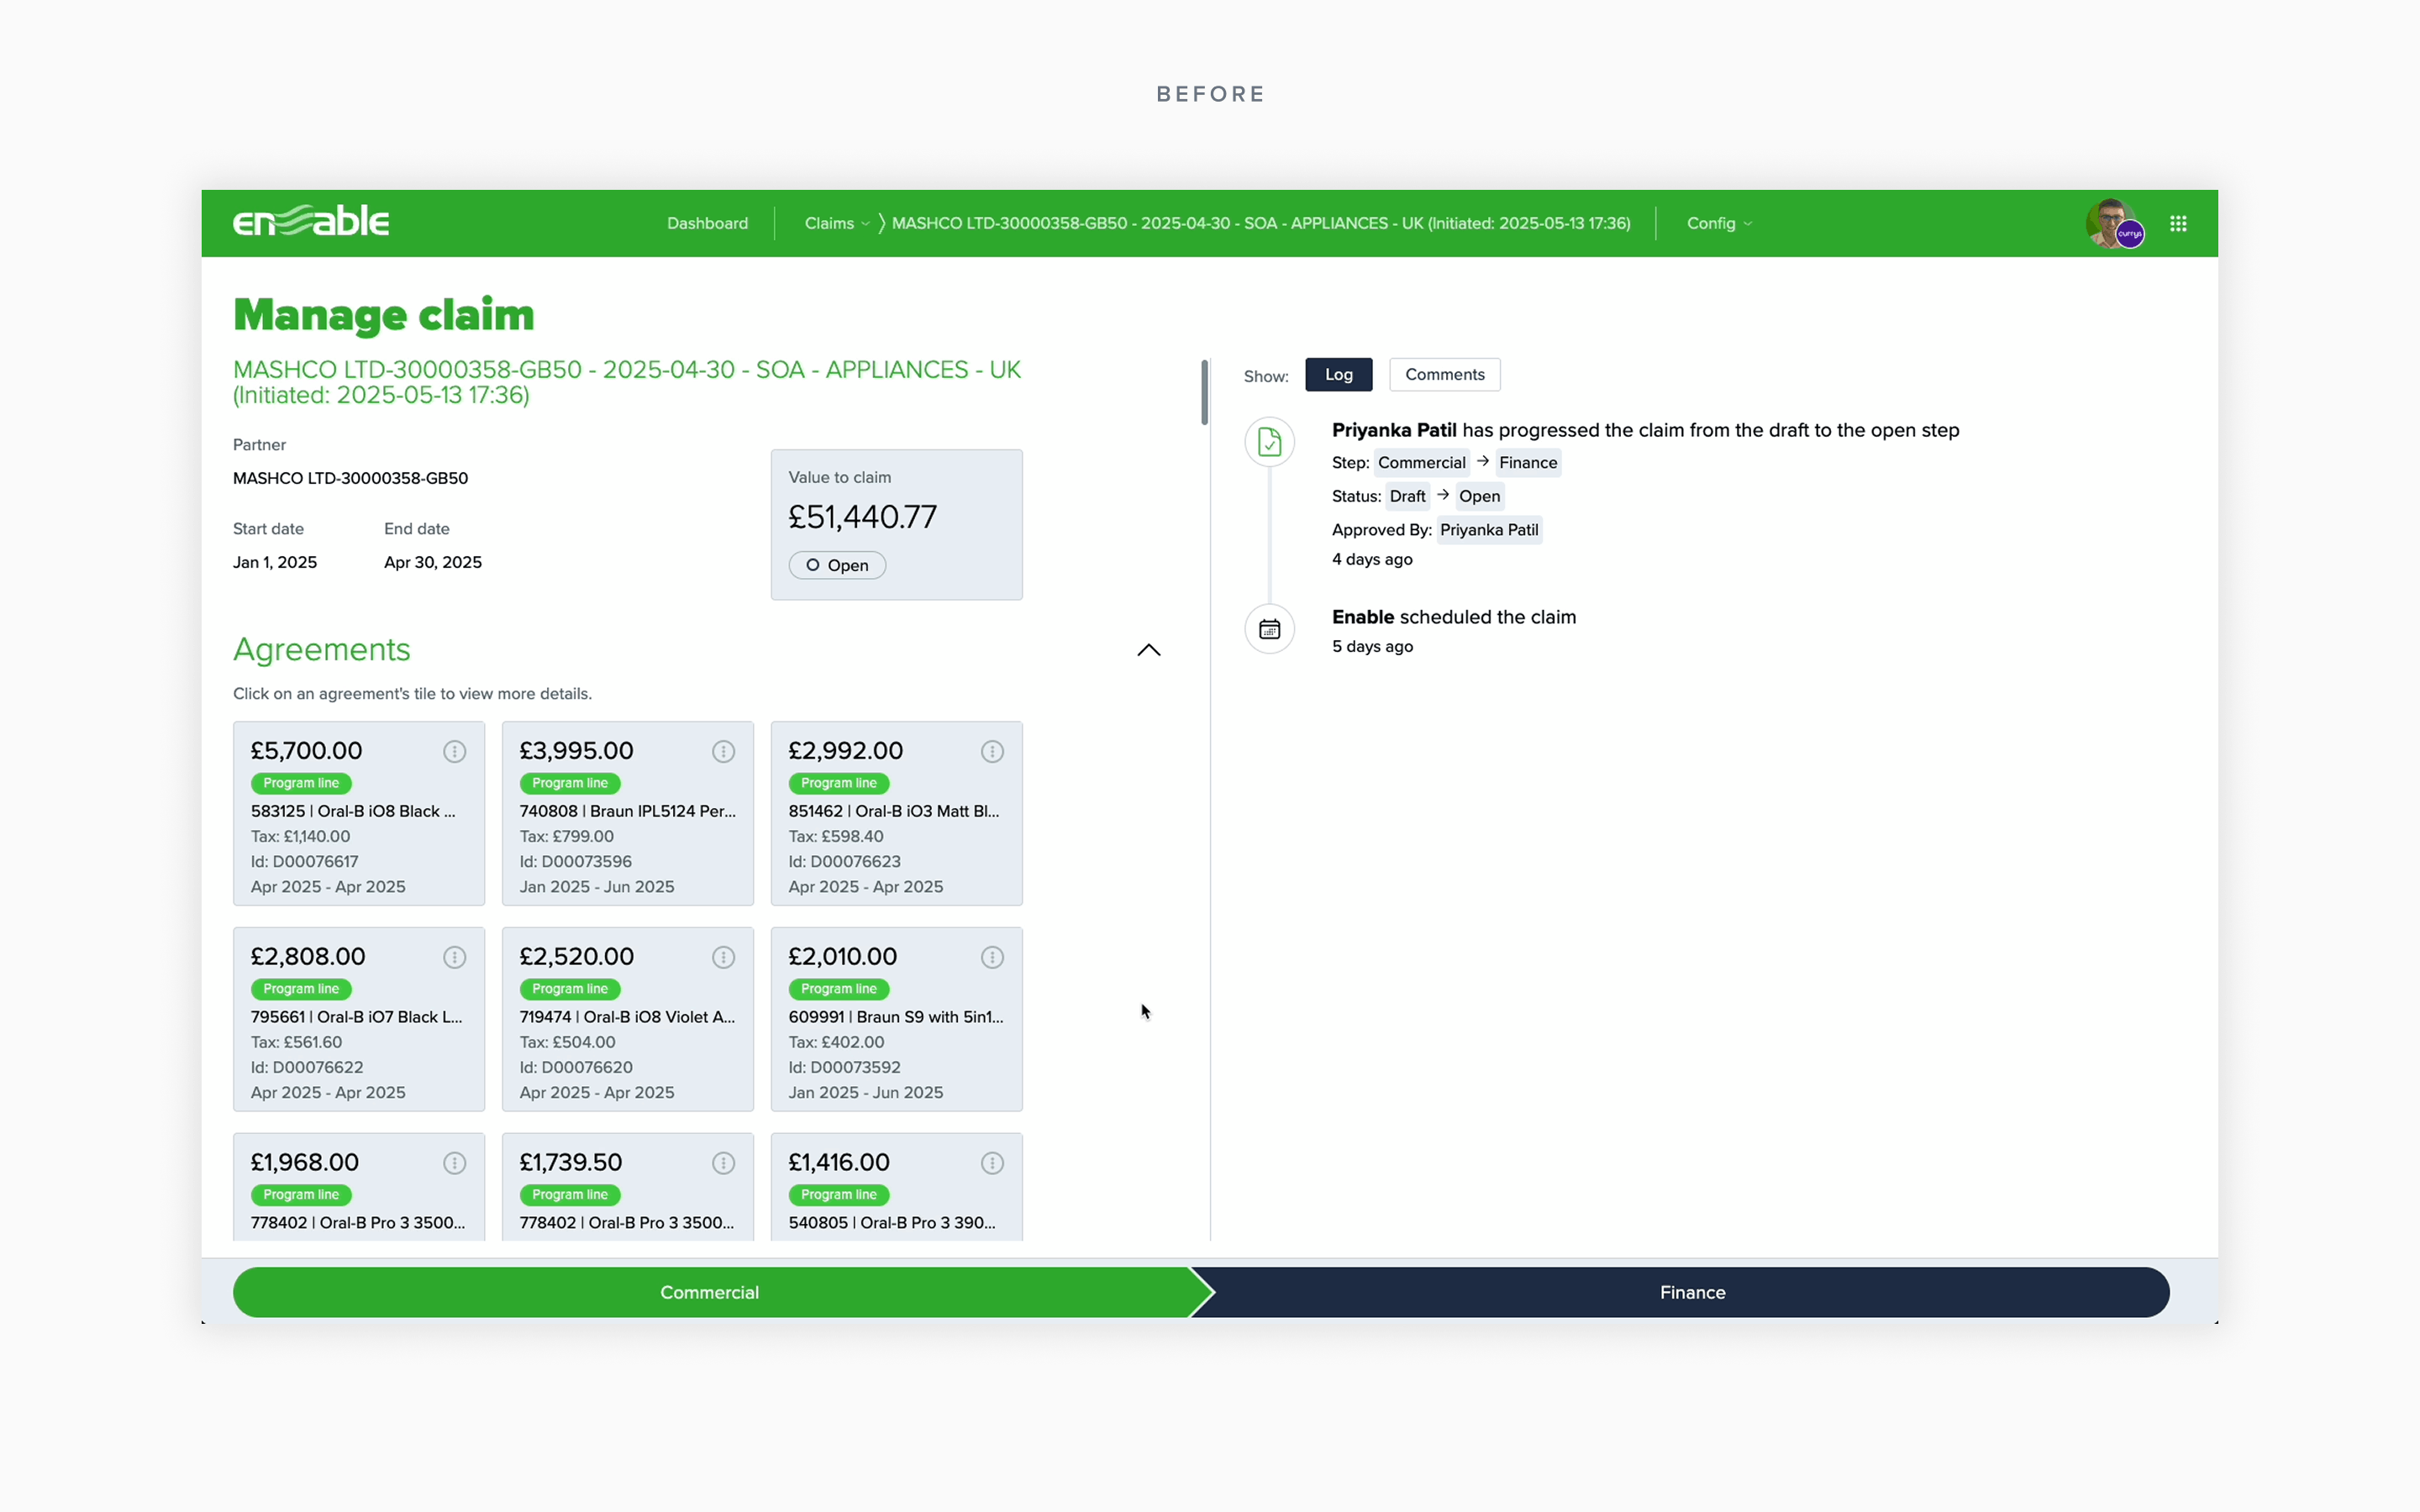
Click to expand
The claims lifecycle: from agreement generation through approval to ERP posting or payment settlement
Problem
A product that couldn't grow
When I joined in November 2024, Claims had existed for over a year — without a designer. The product was functional but had hit a wall. The team couldn't add new features because the interface had no room. The architecture — both UI and technical — wasn't built for growth.
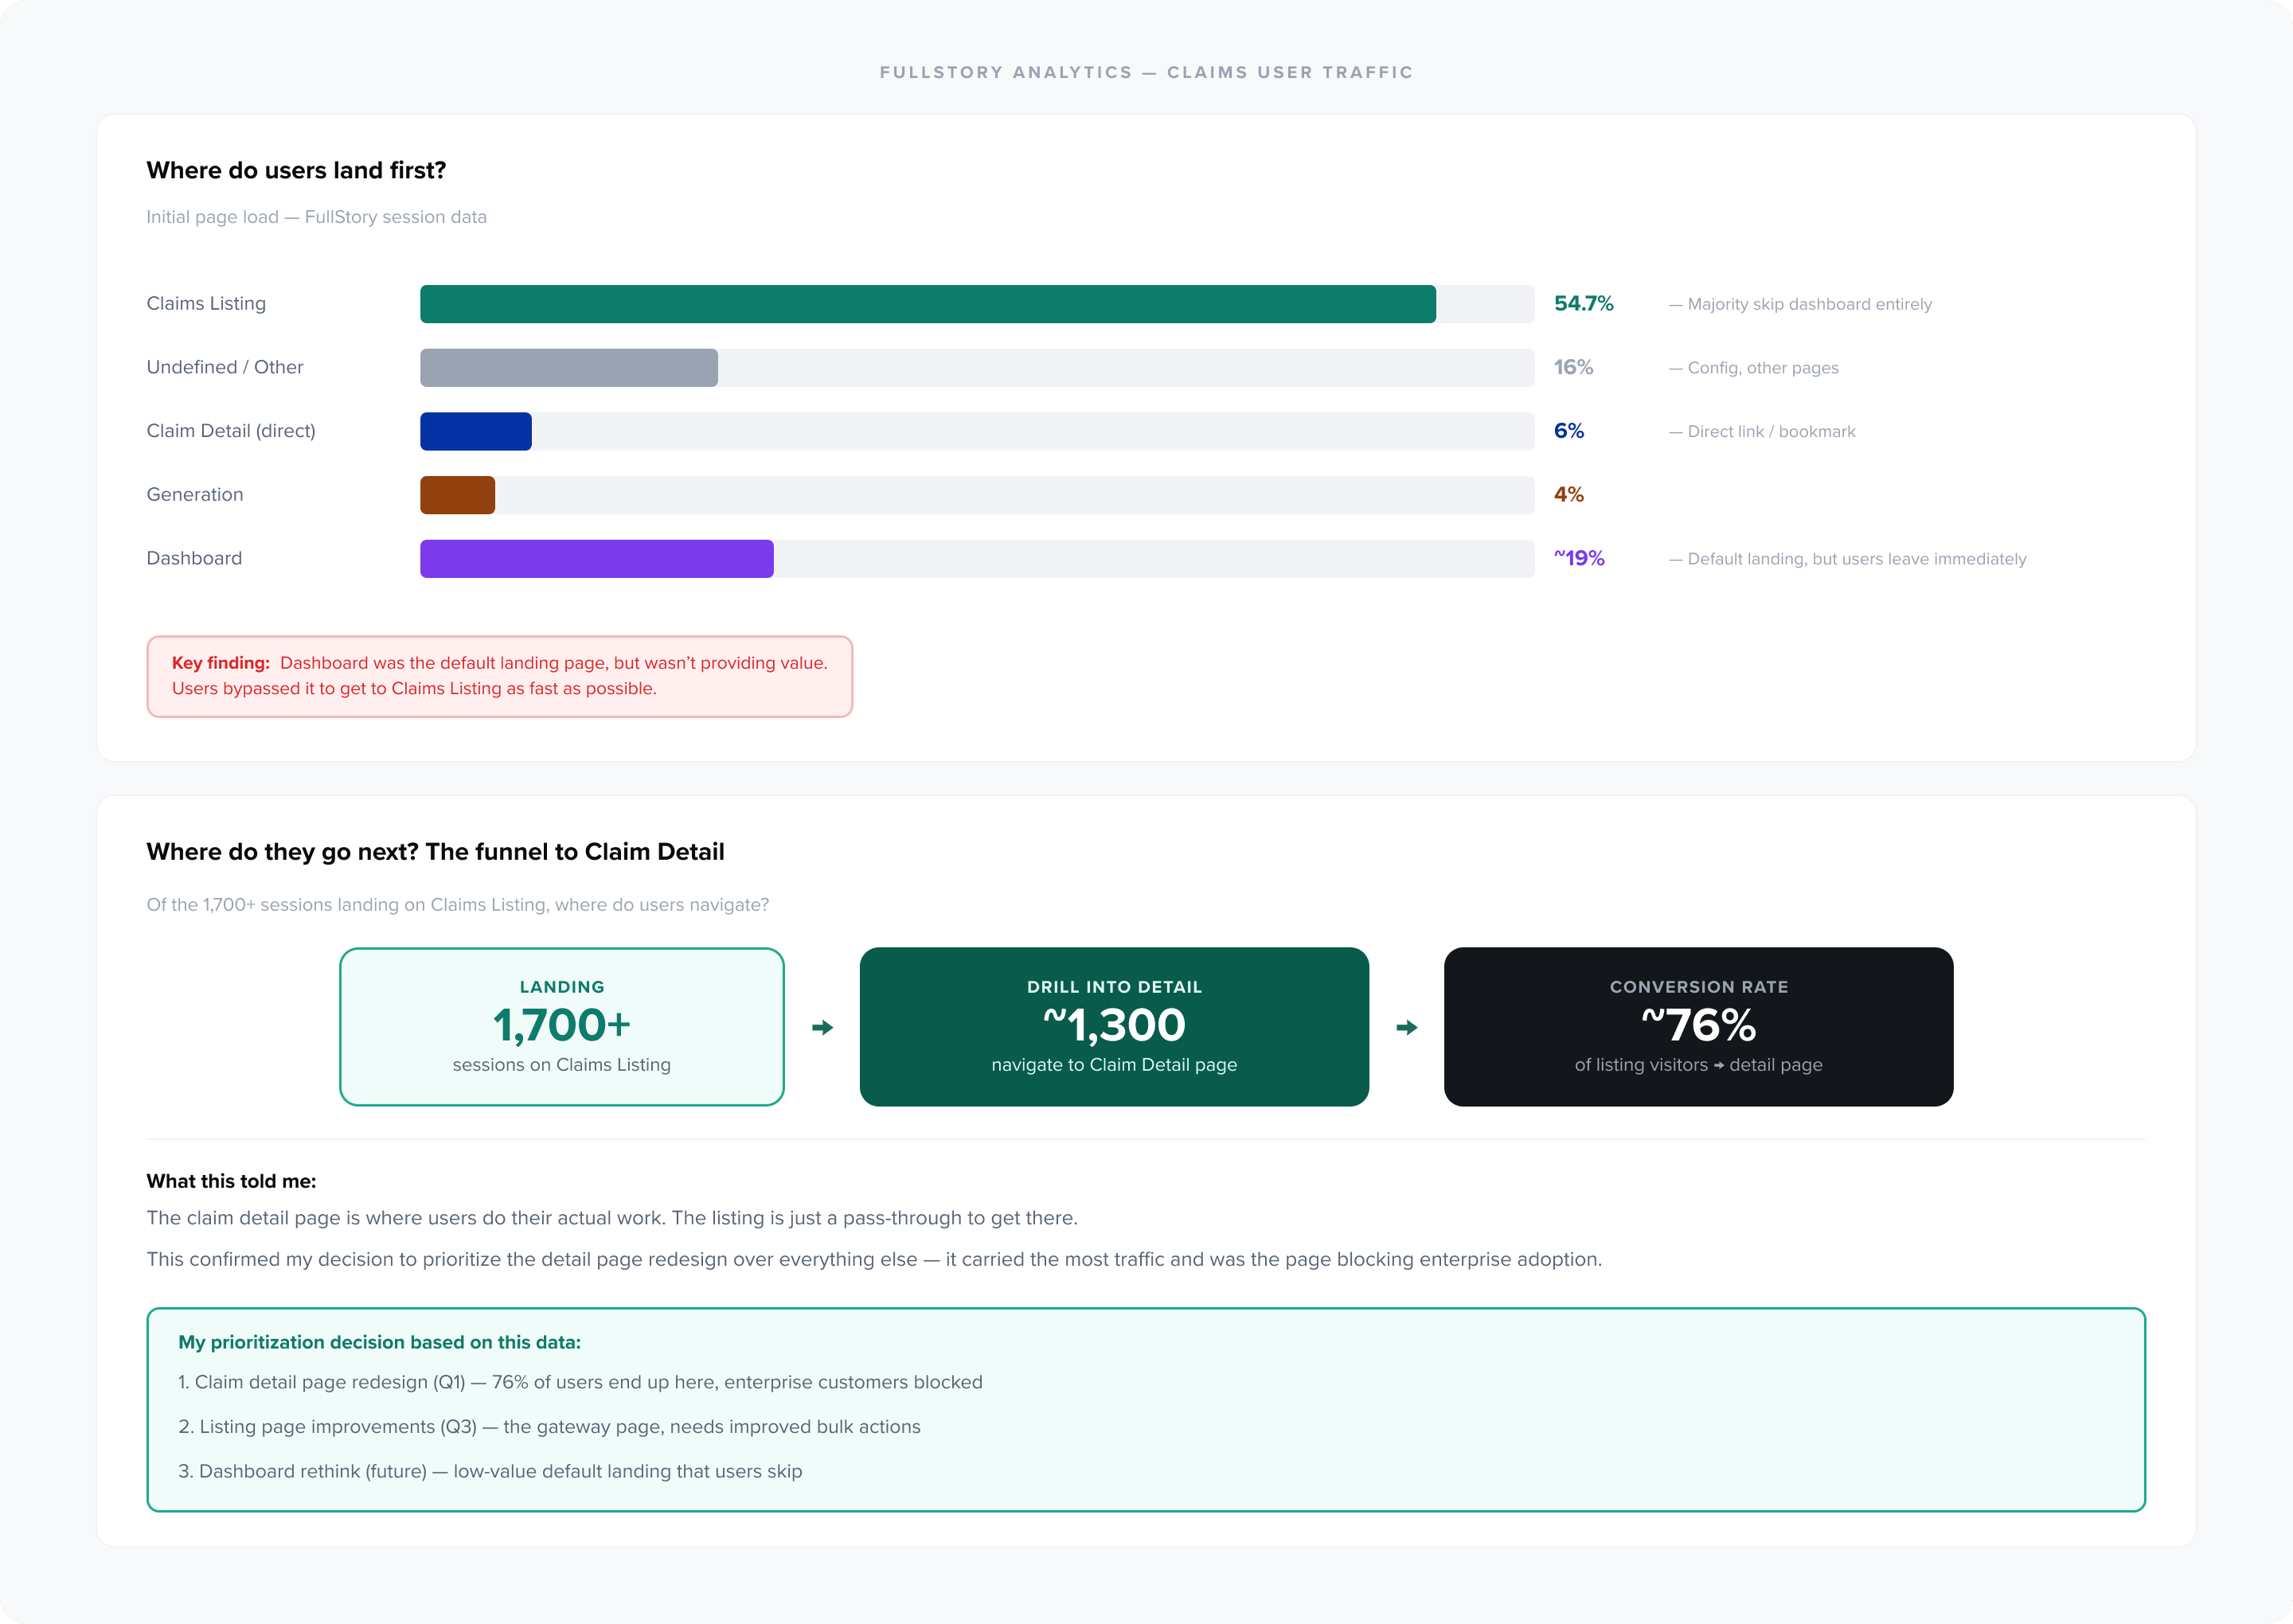
Enterprise customers, who were Enable's primary target, couldn't adopt Claims because it couldn't handle their volume and complexity. FullStory data revealed a clear pattern: 54.7% of users landed on the Claims Listing — skipping the dashboard entirely — and ~76% of them immediately navigated to a Claim Detail page. The detail page was where all actual work happened, and it was the one that was broken.
📁
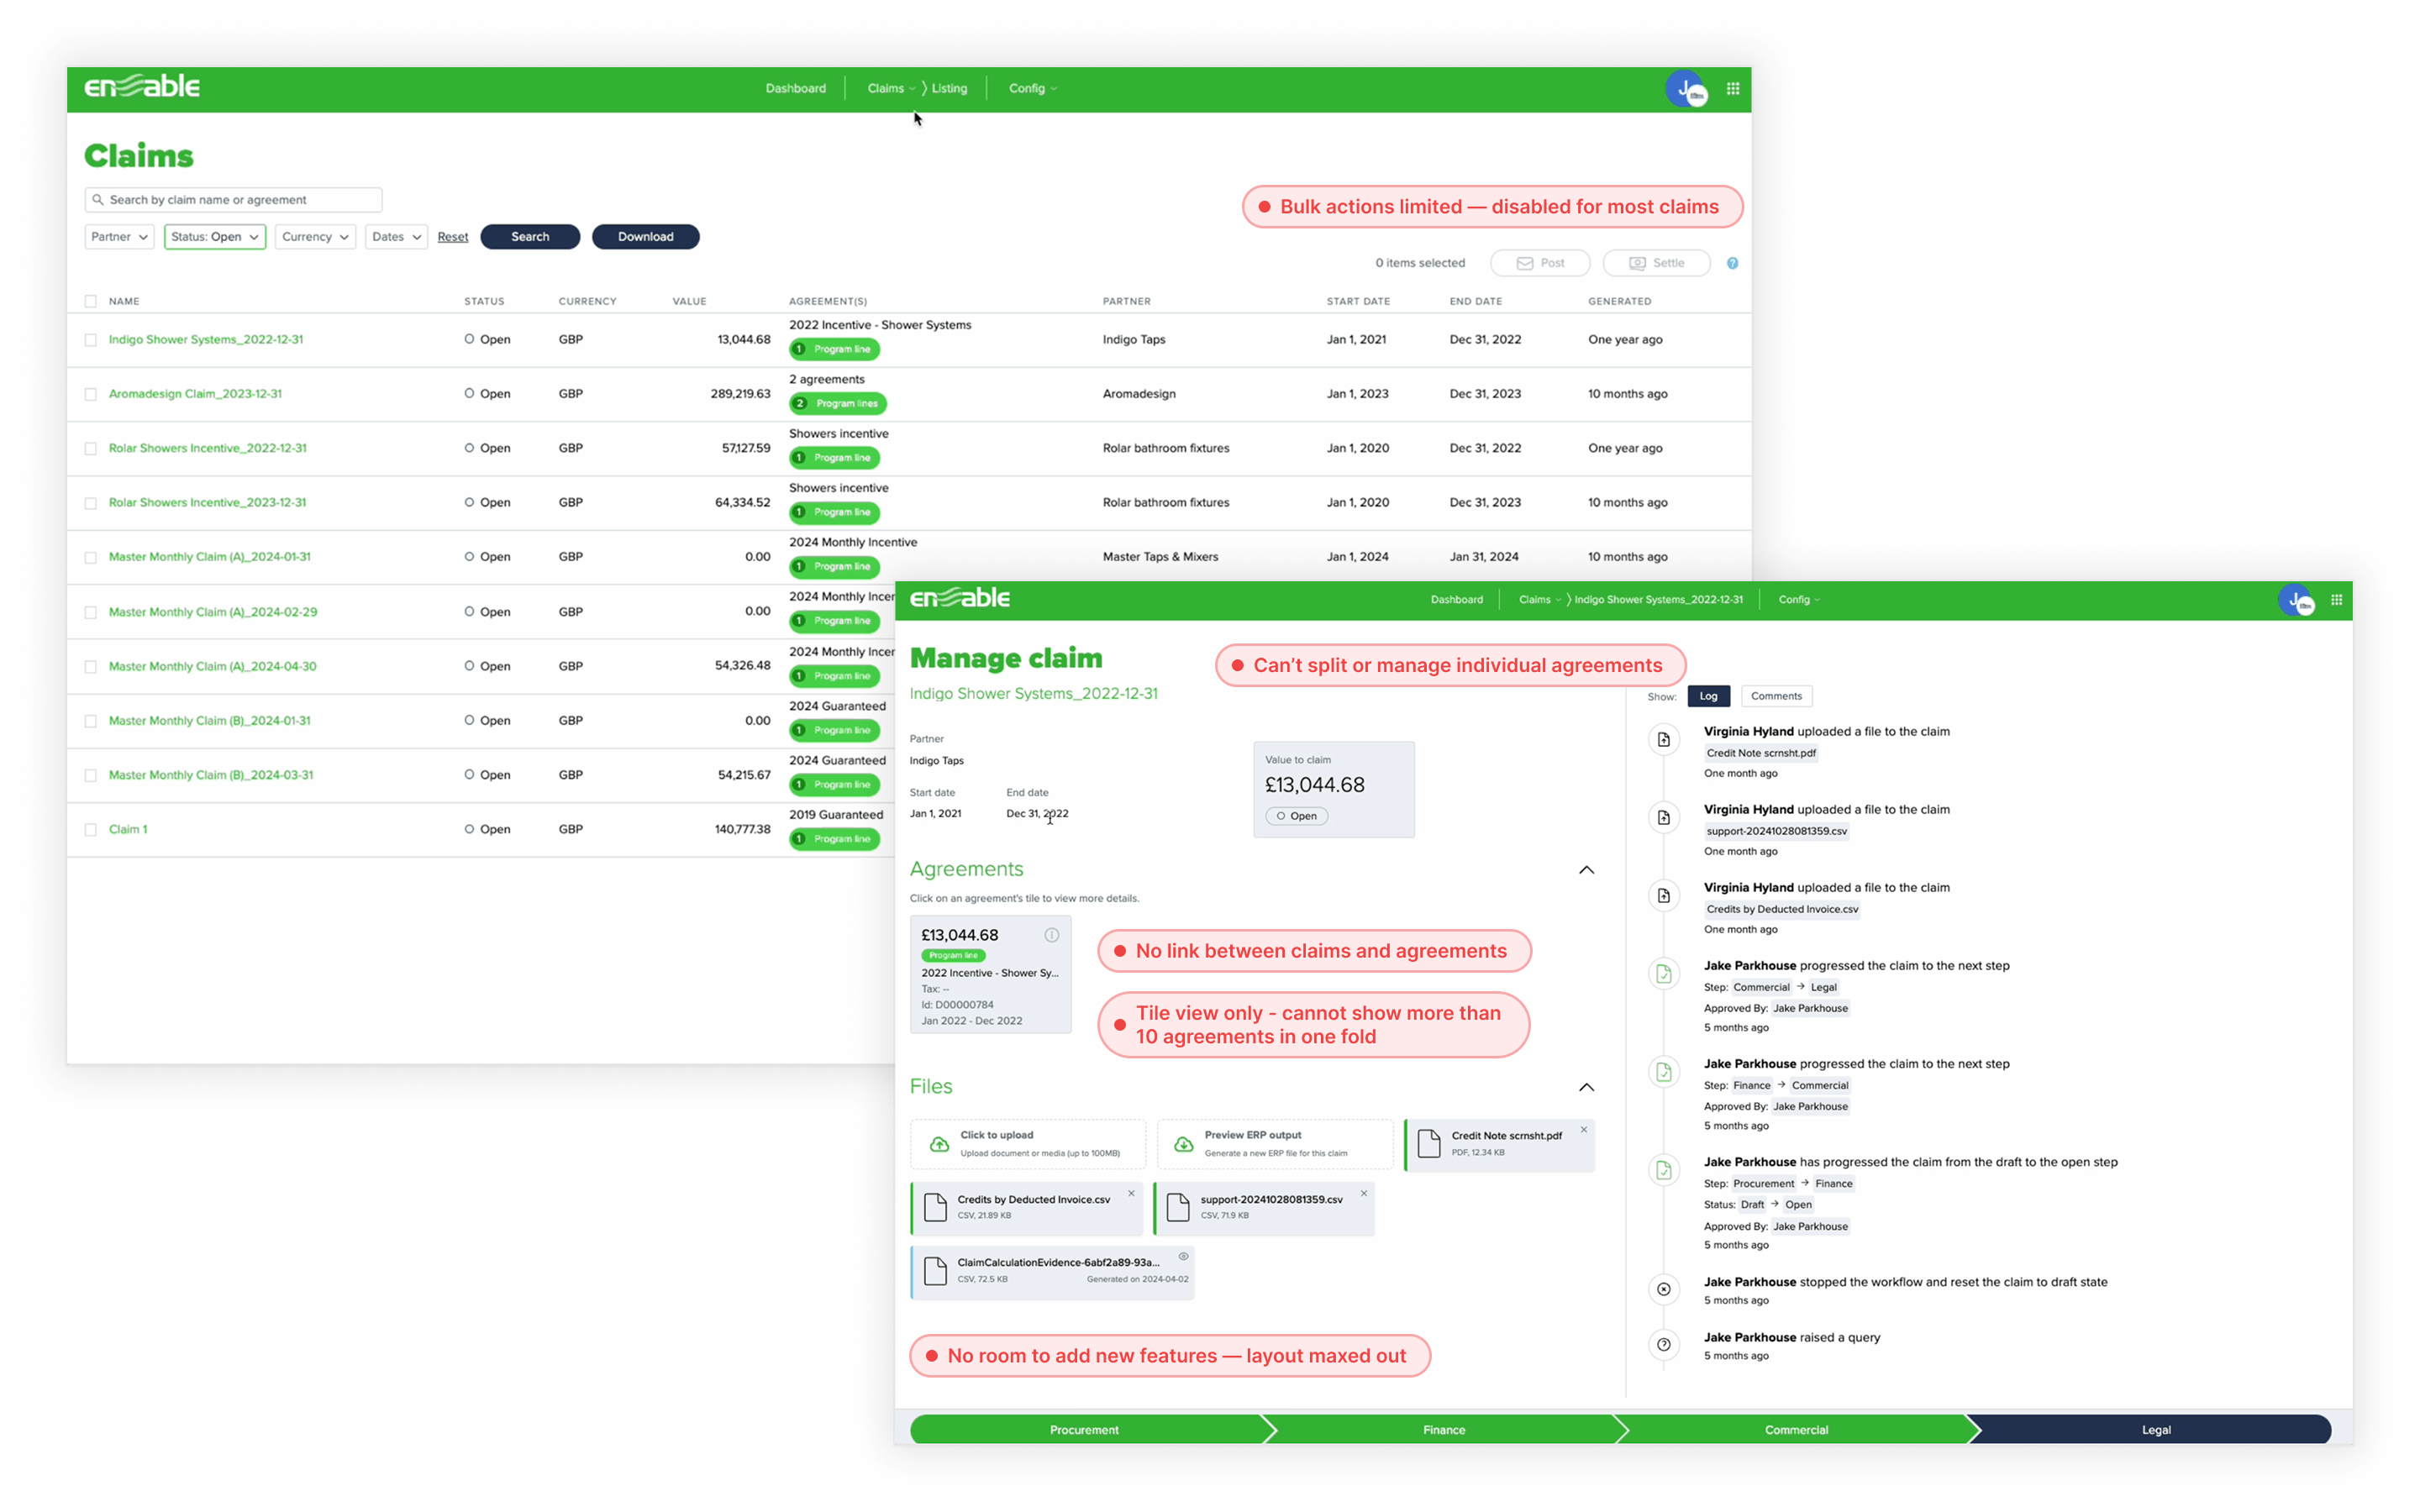
No file management
Claims could contain hundreds of agreements but there was no way to split, reorganize, or manage them — like a folder you can never sort.
🚫
No room to build
The interface was maxed out. Engineers and product constantly ran into the same problem: there's nowhere to put new features.
🏗️
Broken architecture
Agreements couldn't even link to claims due to the underlying technical infrastructure. Design and engineering were both blocked.
The result: Customers were refusing to adopt Claims. If you can only create a folder but never manage what's inside it, you'll use something else. Revenue was stuck, and enterprise deals were stalling because Claims couldn't meet their needs.
Click to expand
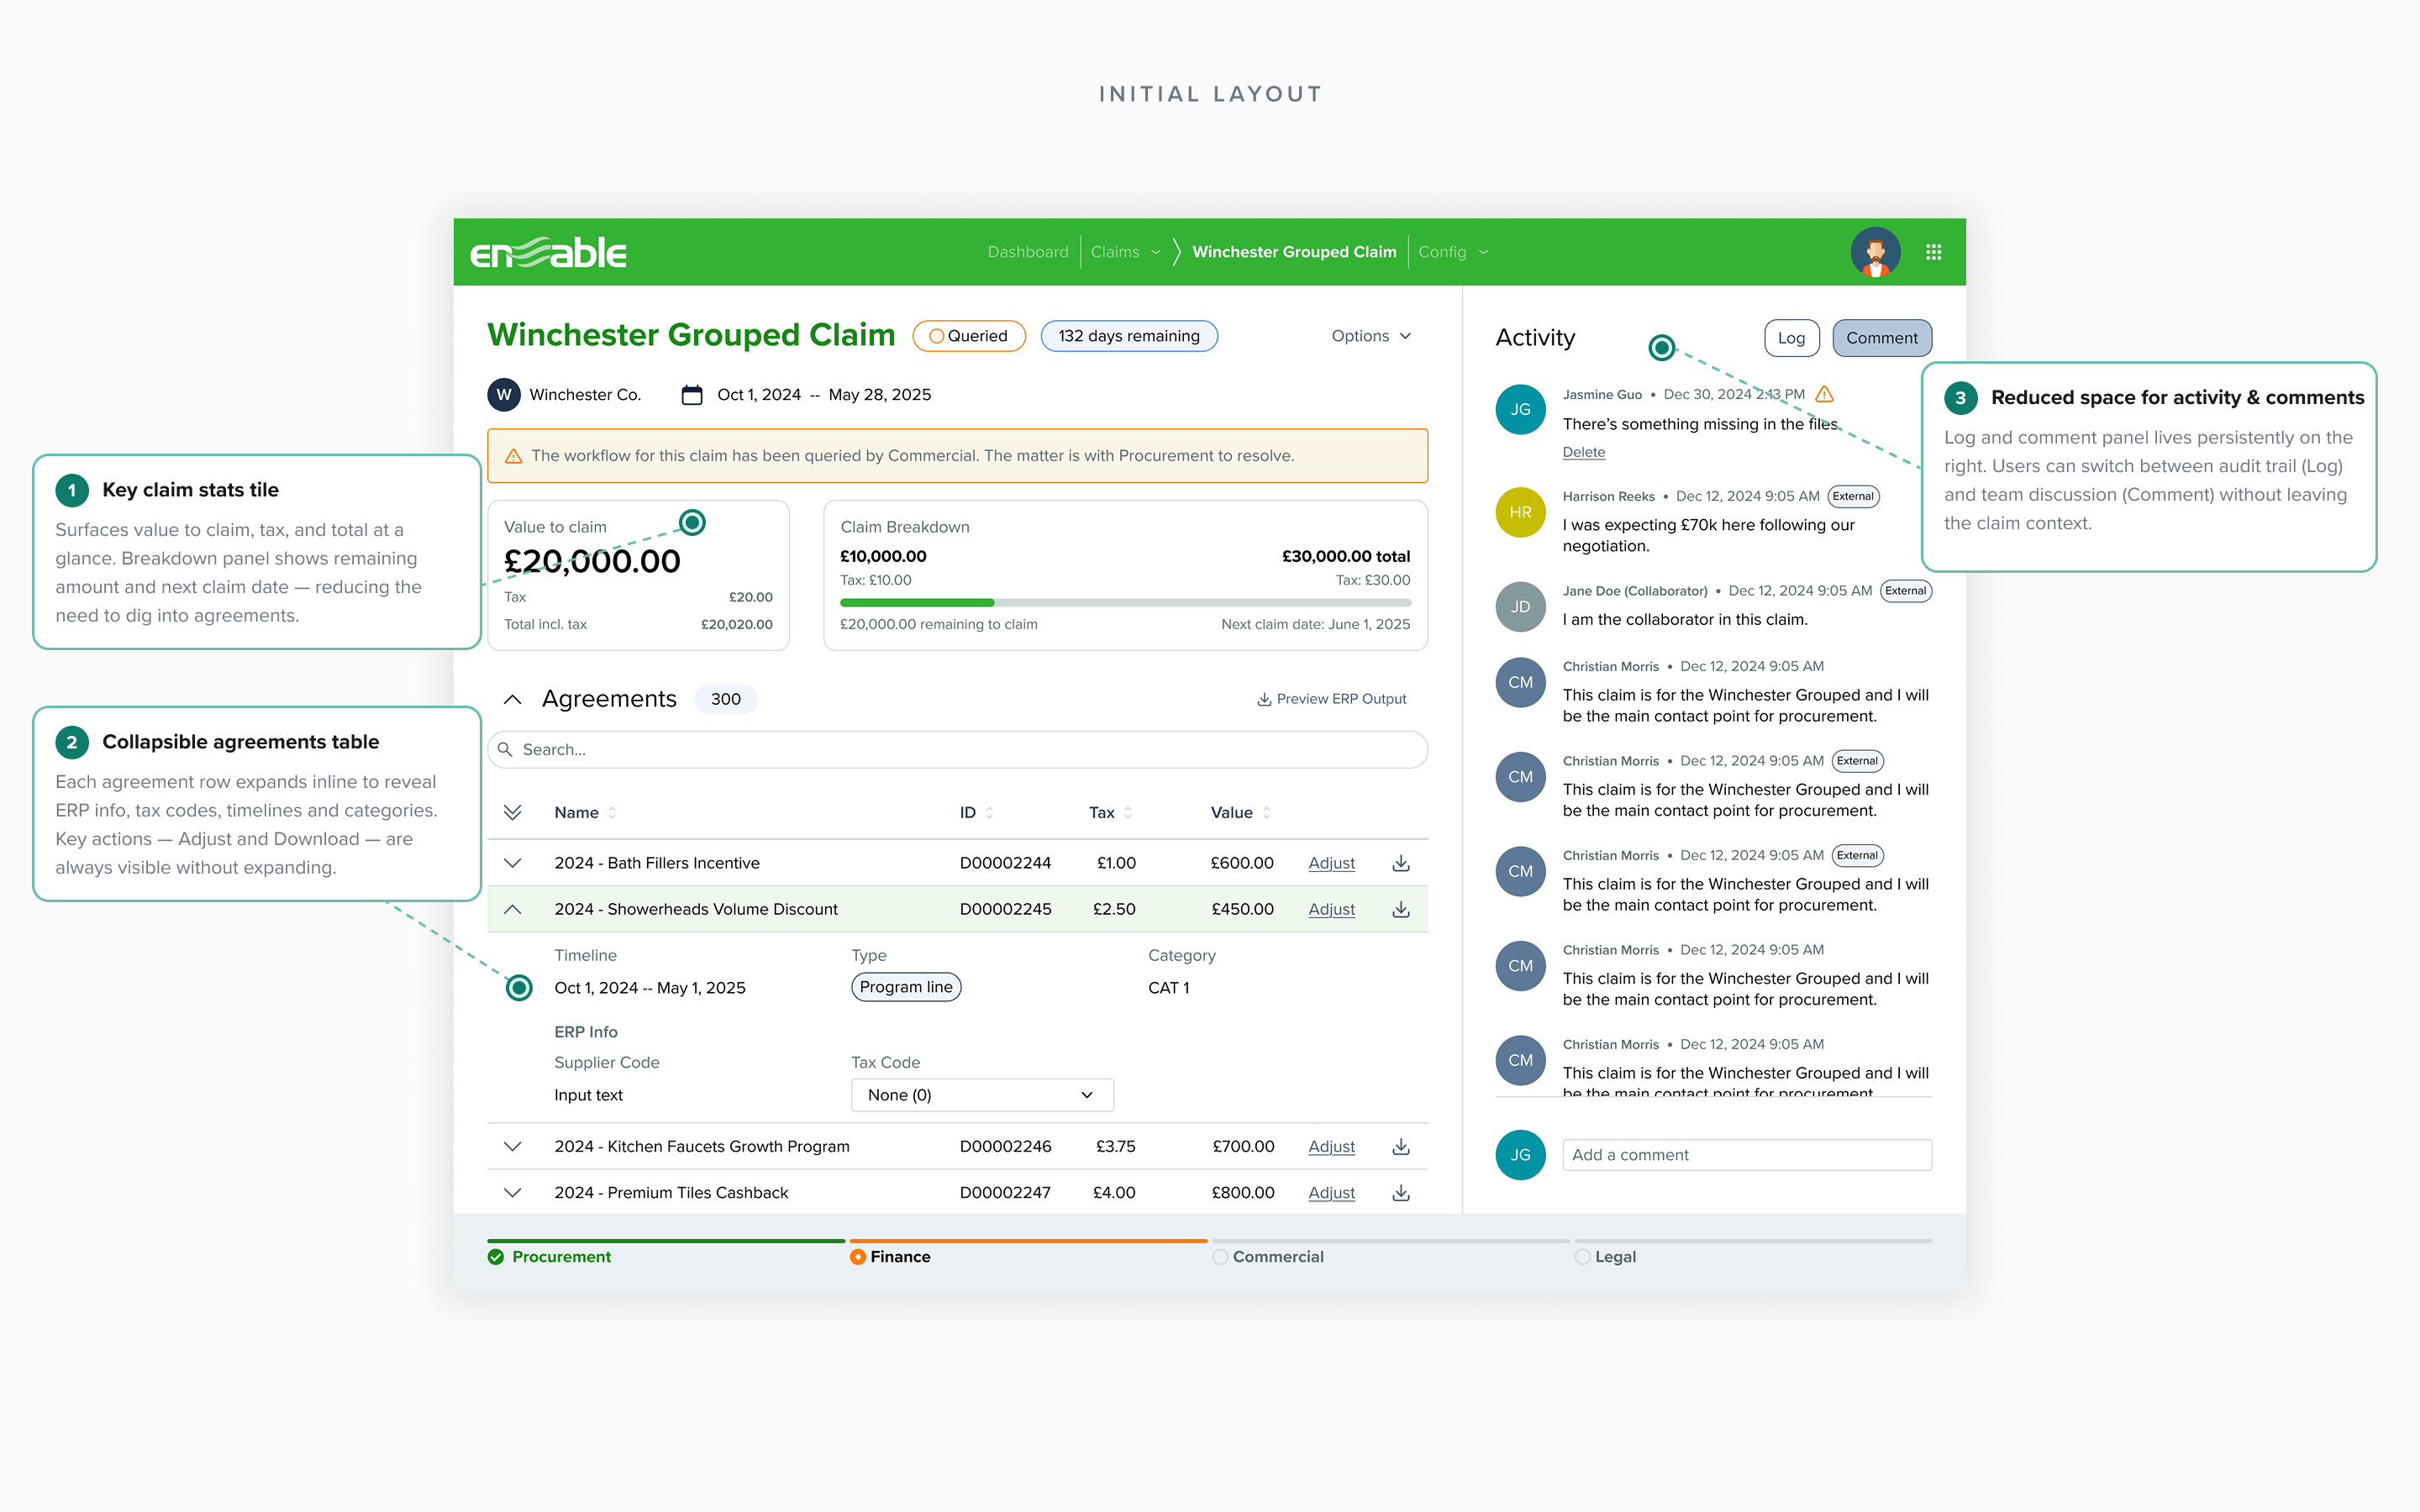
The original claim detail page — functional but unscalable, with no room for the features enterprise customers needed
Discovery
I didn't design anything for the first month
When I joined a team that had never worked with a designer, the temptation was to start producing immediately — to prove value fast. I chose the opposite. I spent my first month solely on research and relationship-building, because I needed to understand the problem deeply enough to make the right decisions about what to fix first and why.
Internal: understanding the technical landscape
I ran workshops with the engineering architects to map the full technical structure of Claims — how data flowed between agreements, claims, and payments, what the database constraints were, and where the architecture was blocking product growth. These sessions were critical: they revealed that the team's frustration with "no space for new features" wasn't just a UI problem — the underlying data model couldn't support features like agreement linking or splitting. I needed to understand this before touching a single pixel, because any redesign that ignored the technical constraints would fail in implementation.
I also attended bi-weekly CS standups, shadowed customer calls, and built relationships with implementation analysts — the people who set up and support every customer's Claims configuration. They became my most valuable source of insight throughout the year.
External: hearing from users directly
I conducted stakeholder and user interviews with category managers, finance teams, and operations leads across different customer segments — from single-user SMBs to 10+ user enterprise accounts. The interviews revealed a pattern: every customer had the same core frustration, but it manifested differently depending on their scale. Small customers couldn't find basic information. Large customers couldn't manage volume. Everyone was working around the product rather than with it.
Quantitative: letting the data prioritize
I analyzed two data sources to validate and prioritize what I was hearing:
FullStory analytics: 54.7% of users landed directly on the Claims Listing — bypassing the dashboard, which was the default landing page but provided no value. From the listing, ~76% of sessions (roughly 1,300 of 1,700+) navigated straight to a Claim Detail page. The listing was just a pass-through; the detail page was where all actual work happened. This made the case for starting there, not with the listing or settings.
Product intake tickets (Jira): I categorized every customer gap ticket and feature request to build a demand map. Splitting was the #1 request by volume. Bulk actions, payments editing, and custom file templates followed. This quantitative picture directly shaped my feature roadmap after the foundation redesign.
Click to expand
Click to expand
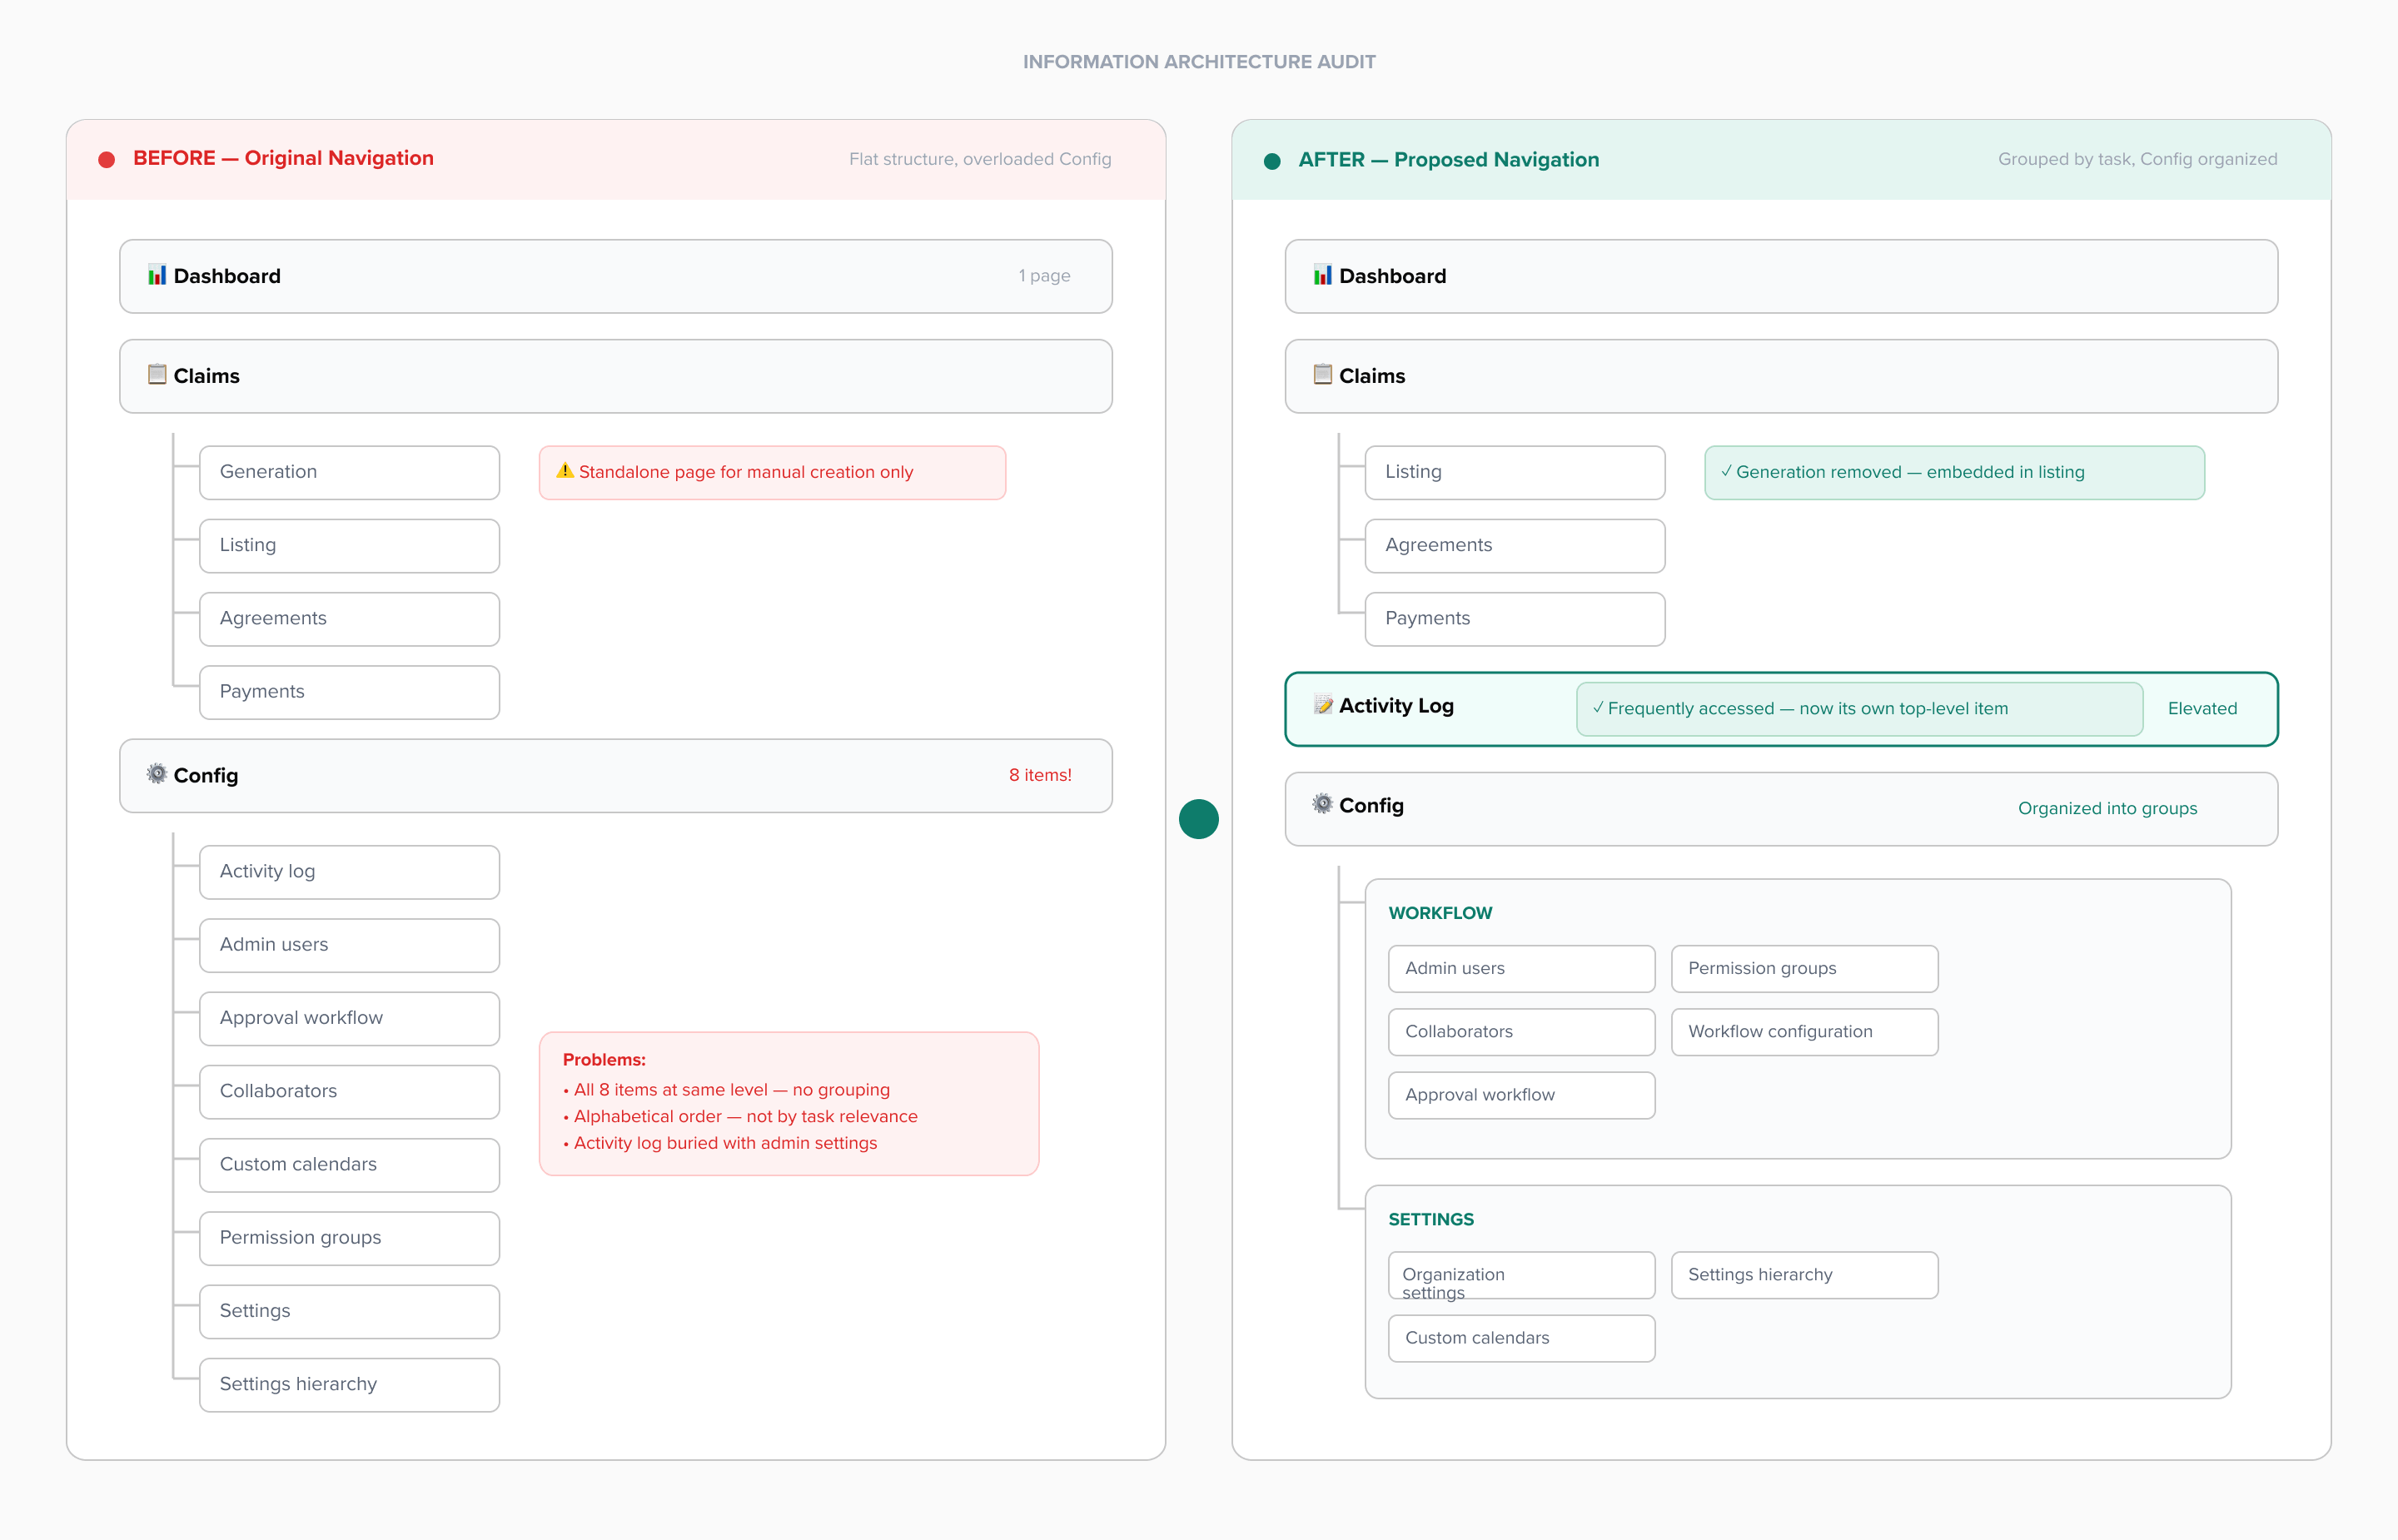
Left: IA and technical architecture mapping from internal workshops. Right: FullStory data confirming the claim detail page as the highest-traffic surface
The decision I made
The IA needed restructuring. The listing page needed bulk actions. Payments needed a complete overhaul. There was no shortage of problems. But I made a deliberate decision to start with the claim detail page and treat it as a joint design-engineering rearchitecture — not just a visual refresh. My reasoning:
It carried 75% of traffic — highest impact per unit of effort
Enterprise customers were blocked by it — directly tied to revenue
Every future feature (splitting, payments, templates) depended on a scalable foundation here
The technical constraints meant design and engineering had to rebuild together — starting anywhere else would just create a prettier version of a broken architecture
This wasn't the fastest path to shipping something visible. But it was the right one. I had to convince the PM and engineering lead that investing 3 months in the foundation would pay off in velocity later — and the research gave me the evidence to make that case.
Foundation
Rebuilding the core — and the way the team works
From January to March 2025, I led the redesign of the claim detail page. But "led" doesn't mean I designed it alone and handed it over. It means I shaped the direction for both the UI and the technical architecture, working side-by-side with engineering architects in daily sessions to ensure the design decisions and data model decisions were made together.
This was necessary because the previous infrastructure couldn't support features like agreement linking or splitting — the two most-requested capabilities. If I'd designed a beautiful new UI on the same broken foundation, we'd have the same problem within months. I pushed for a joint rearchitecture, and the research data from discovery gave me the credibility to make that case to engineering leadership.
What I optimized for
📐
Scalable layout
I designed for the next 10 features, not the current one. Every layout decision was stress-tested: "Where does splitting go? Where do payments live? What happens when there are 200 agreements?"
🏢
Enterprise-ready
I brought user interview insights into every design review — specifically the pain points of high-volume customers like Currys (23+ agreements per claim) and City Electrical (42+ agreements).
🎨
Design system first
I made Claims the first product surface to implement Enable's new design system — advocating for this even when it added short-term effort, because it would set the standard for every team after us.
🧩
Component library
I partnered with the front-end tech lead to build a reusable component library for Claims — I defined the design specs, he built the code. This cut implementation time for subsequent features by roughly 40%.
Design iterations
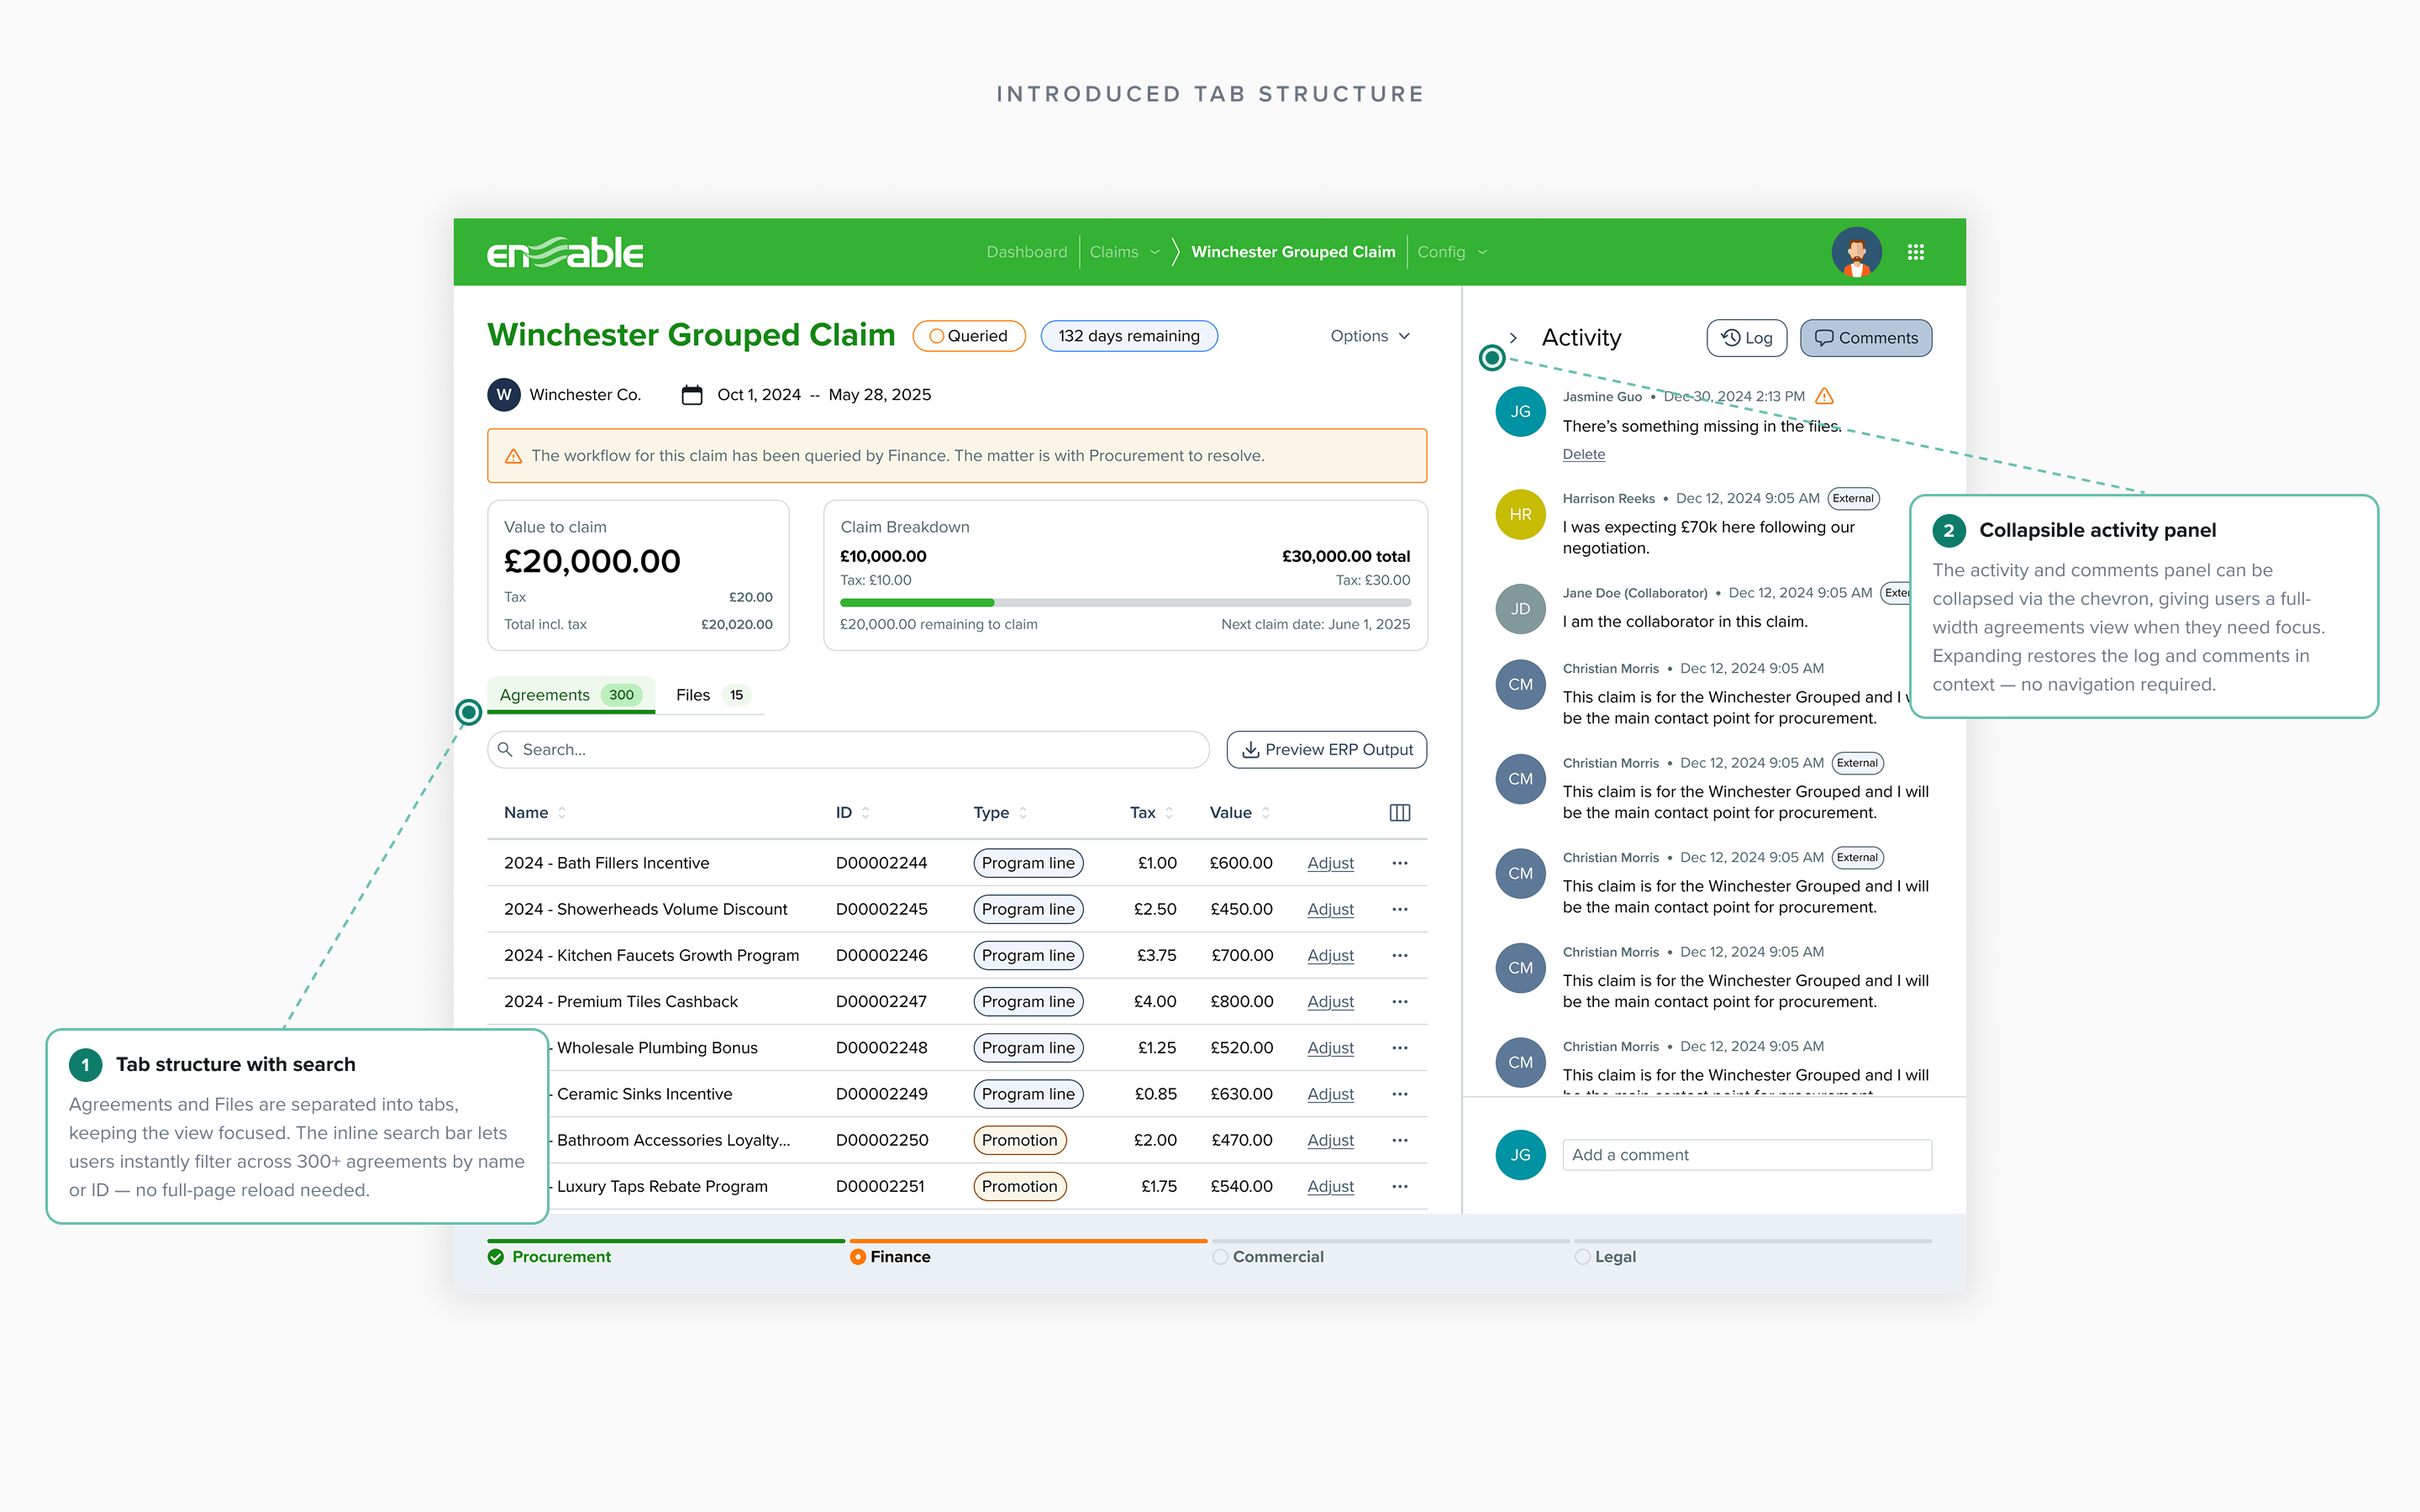
I explored multiple layout approaches before arriving at the final structure. Each iteration was tested against the same question: does this accommodate the full feature roadmap without running out of space?
Iteration 1 — mapping all content requirements and exploring information hierarchy options
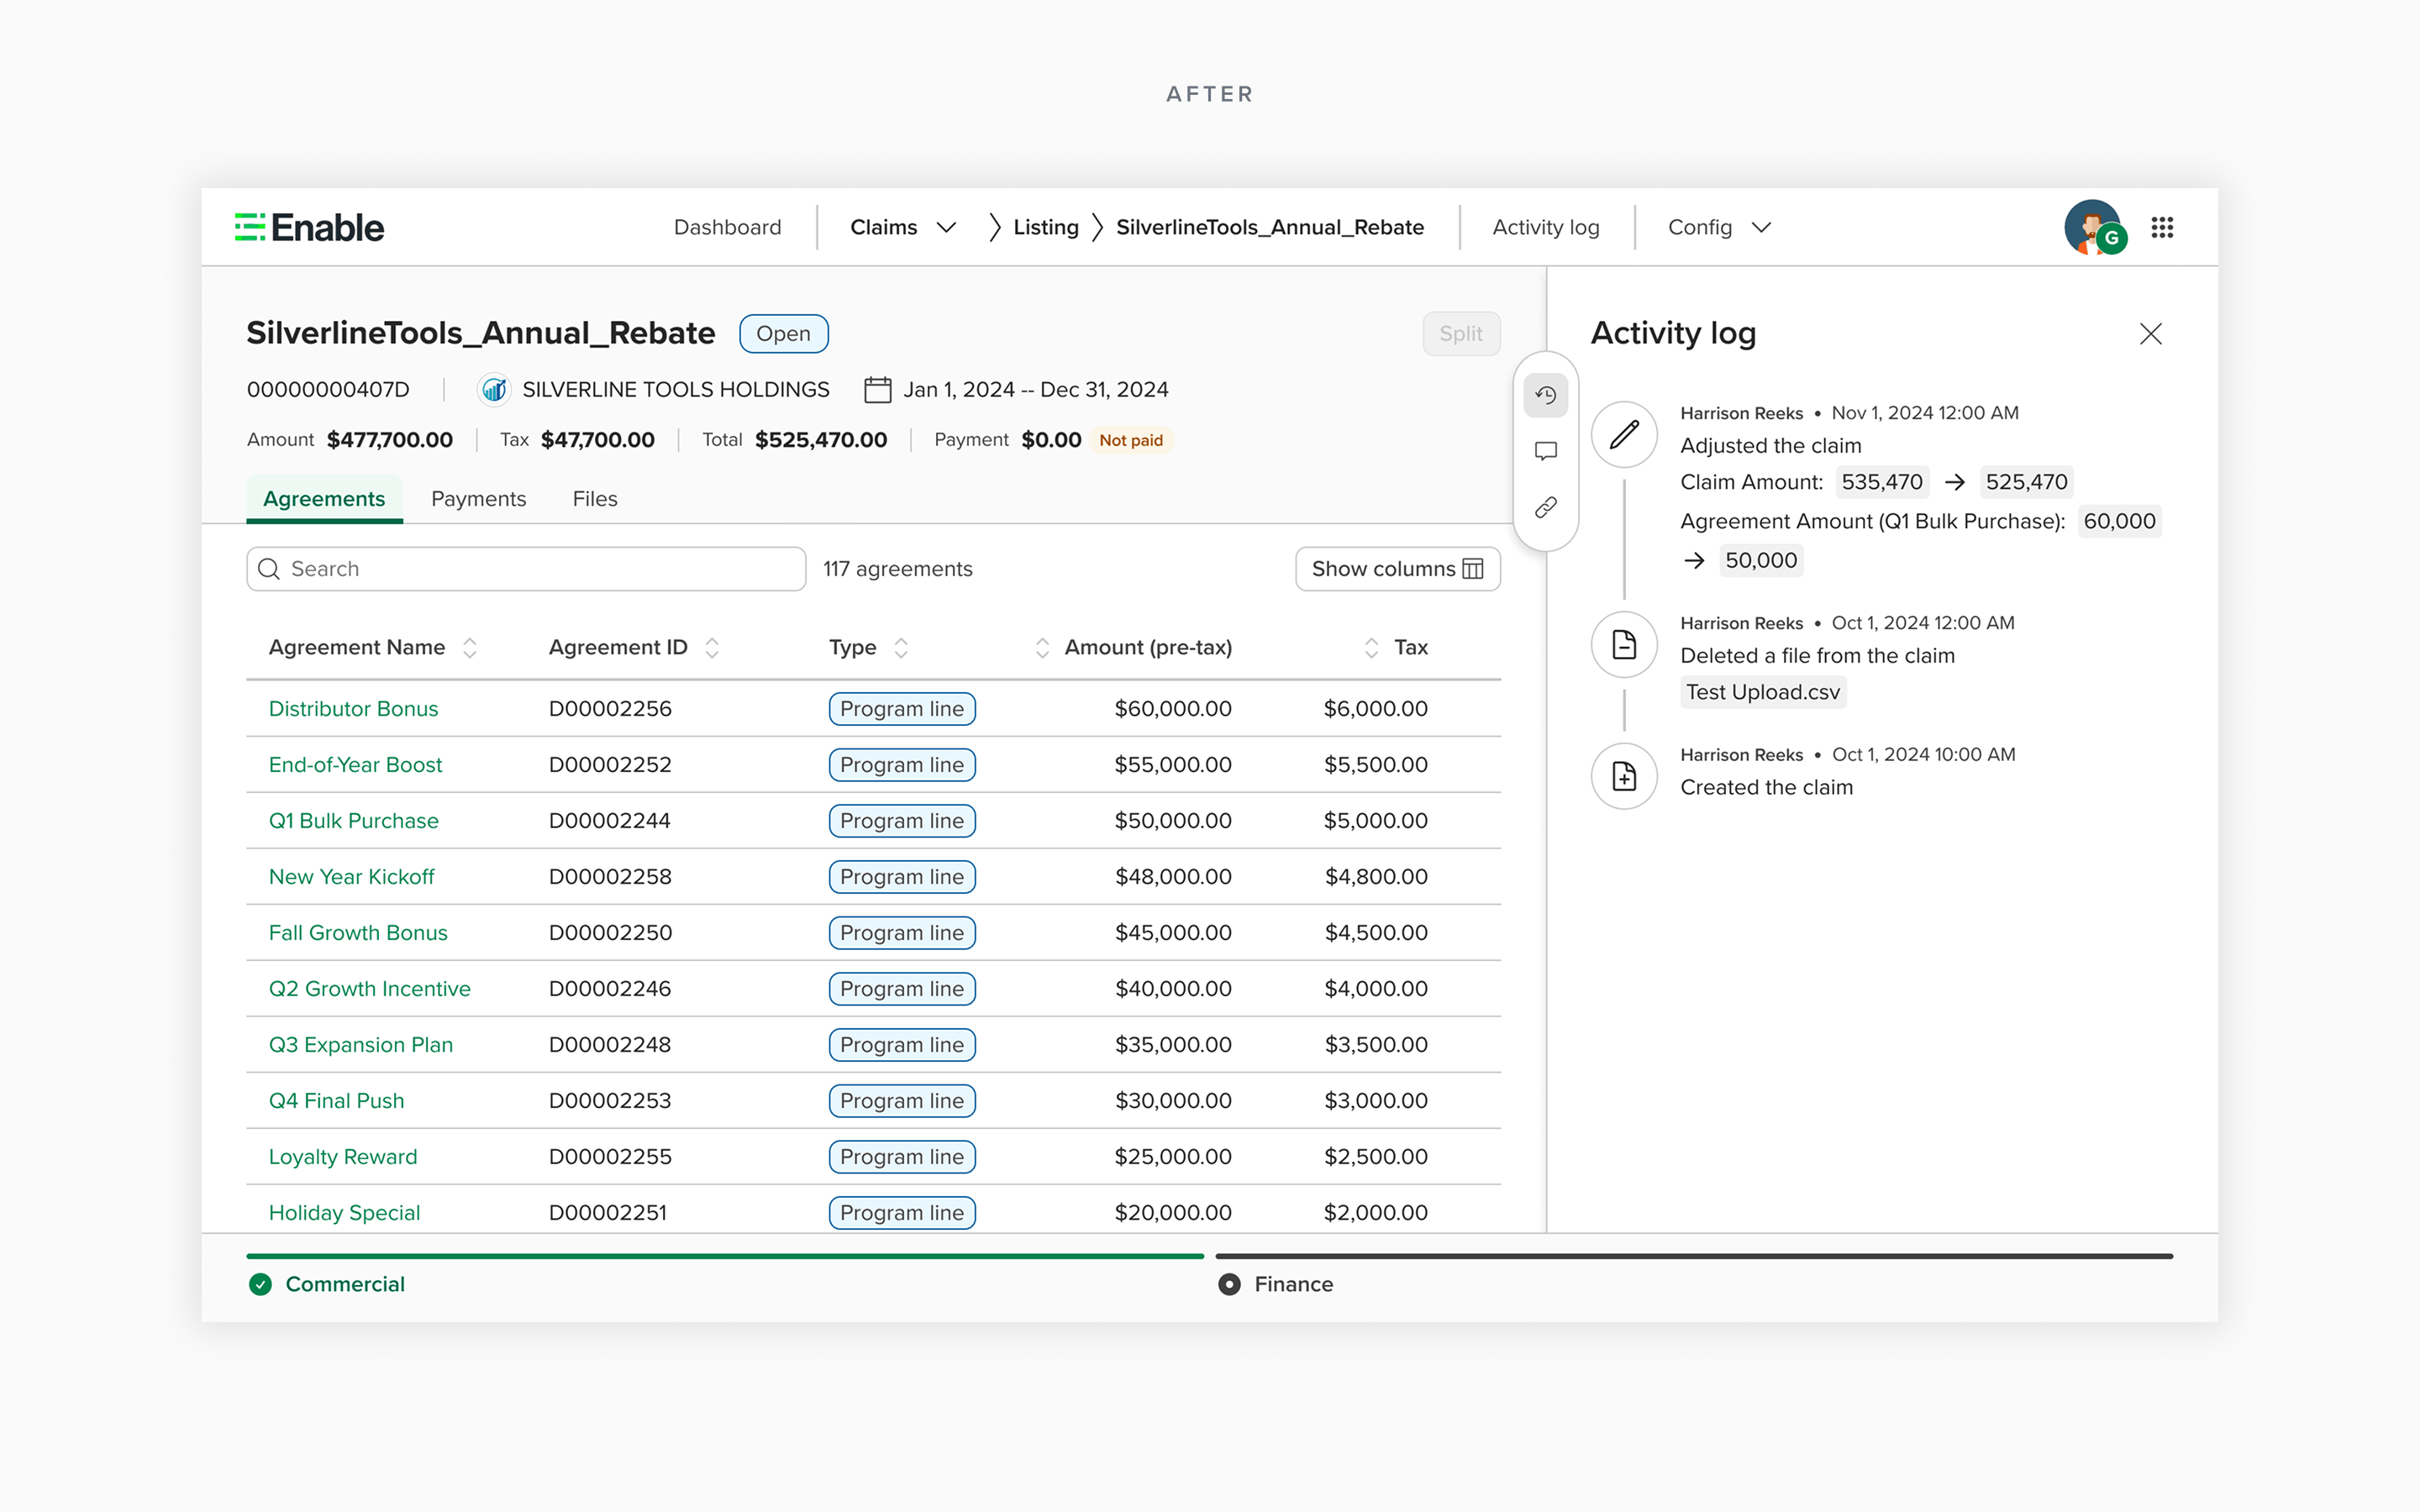
Click to expand
Click to expand
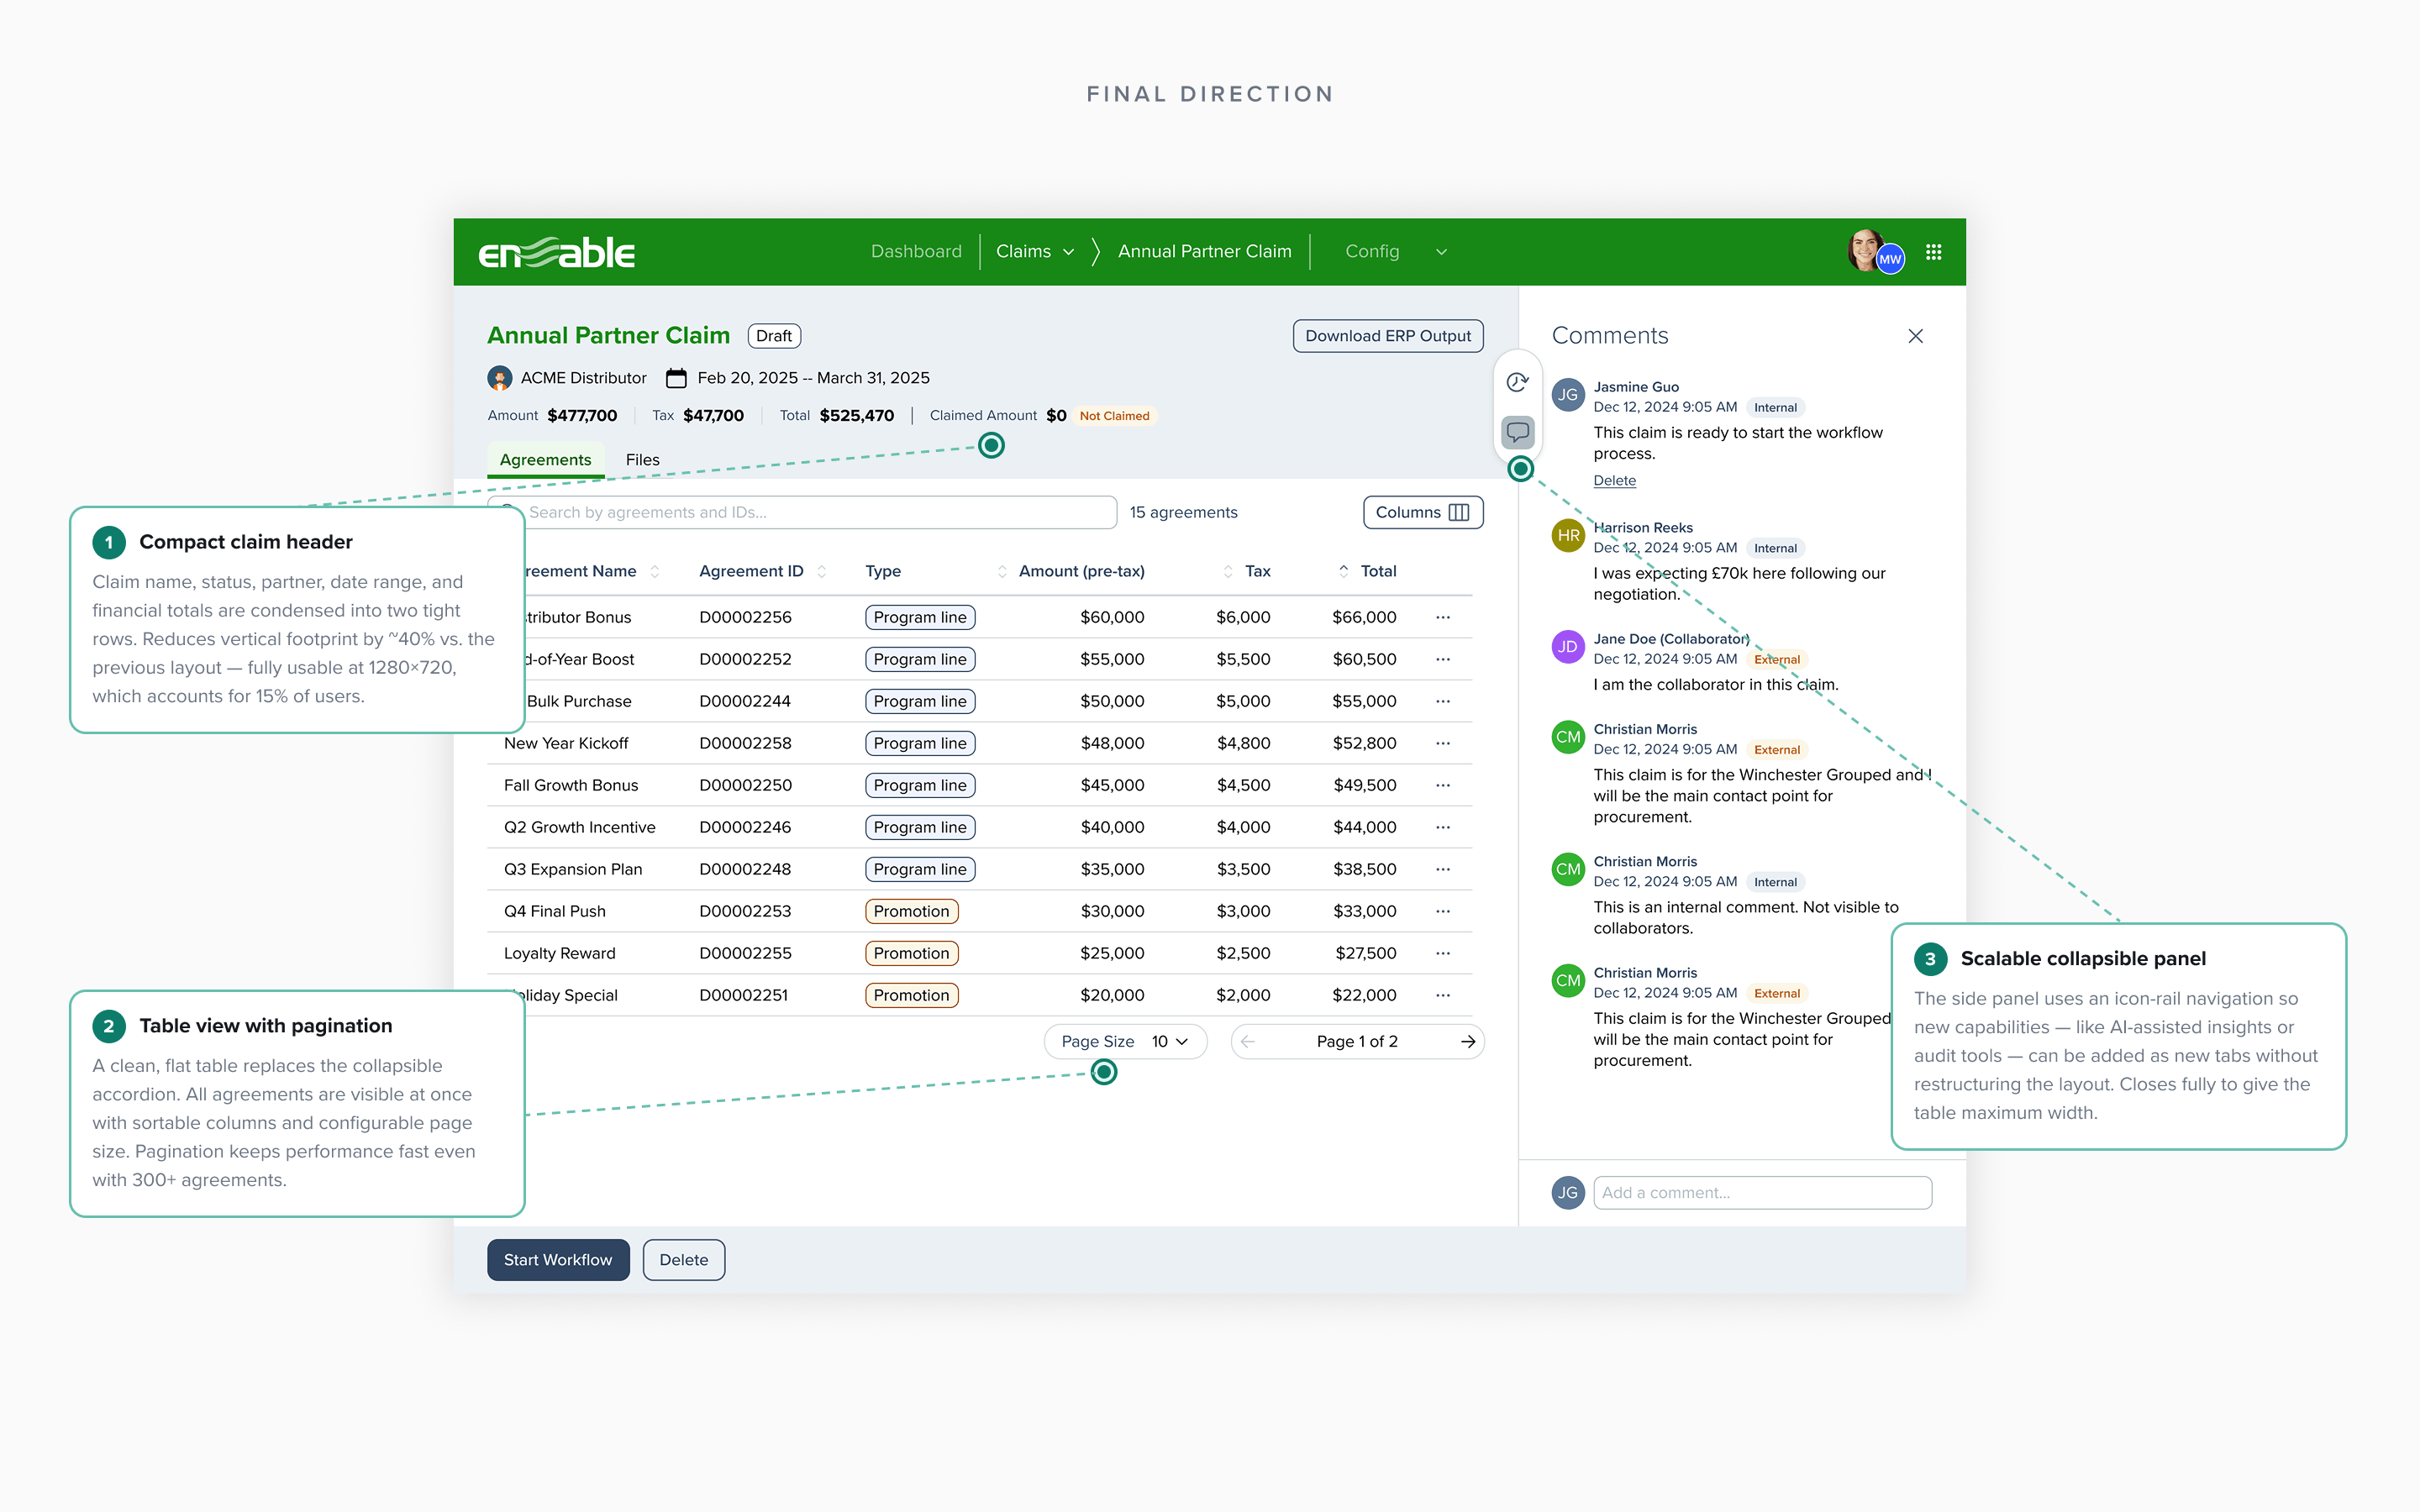
Before and after: the claim detail page redesign — from cramped, unscalable layout to a structured, extensible design
Scaling Up →Scaling Up →Scaling Up →Scaling Up →Scaling Up →Scaling Up →Scaling Up →Scaling Up →Scaling Up →Scaling Up →Scaling Up →Scaling Up →Scaling Up →Scaling Up →Scaling Up →Scaling Up →Scaling Up →Scaling Up →Scaling Up →Scaling Up →Scaling Up →Scaling Up →Scaling Up →Scaling Up →
Features
10+ features shipped in 9 months
With the foundation in place, the redesigned architecture unlocked a rapid sequence of high-impact features — each one previously impossible. Here's how the platform scaled from April to December 2025.
01
Most Requested Feature
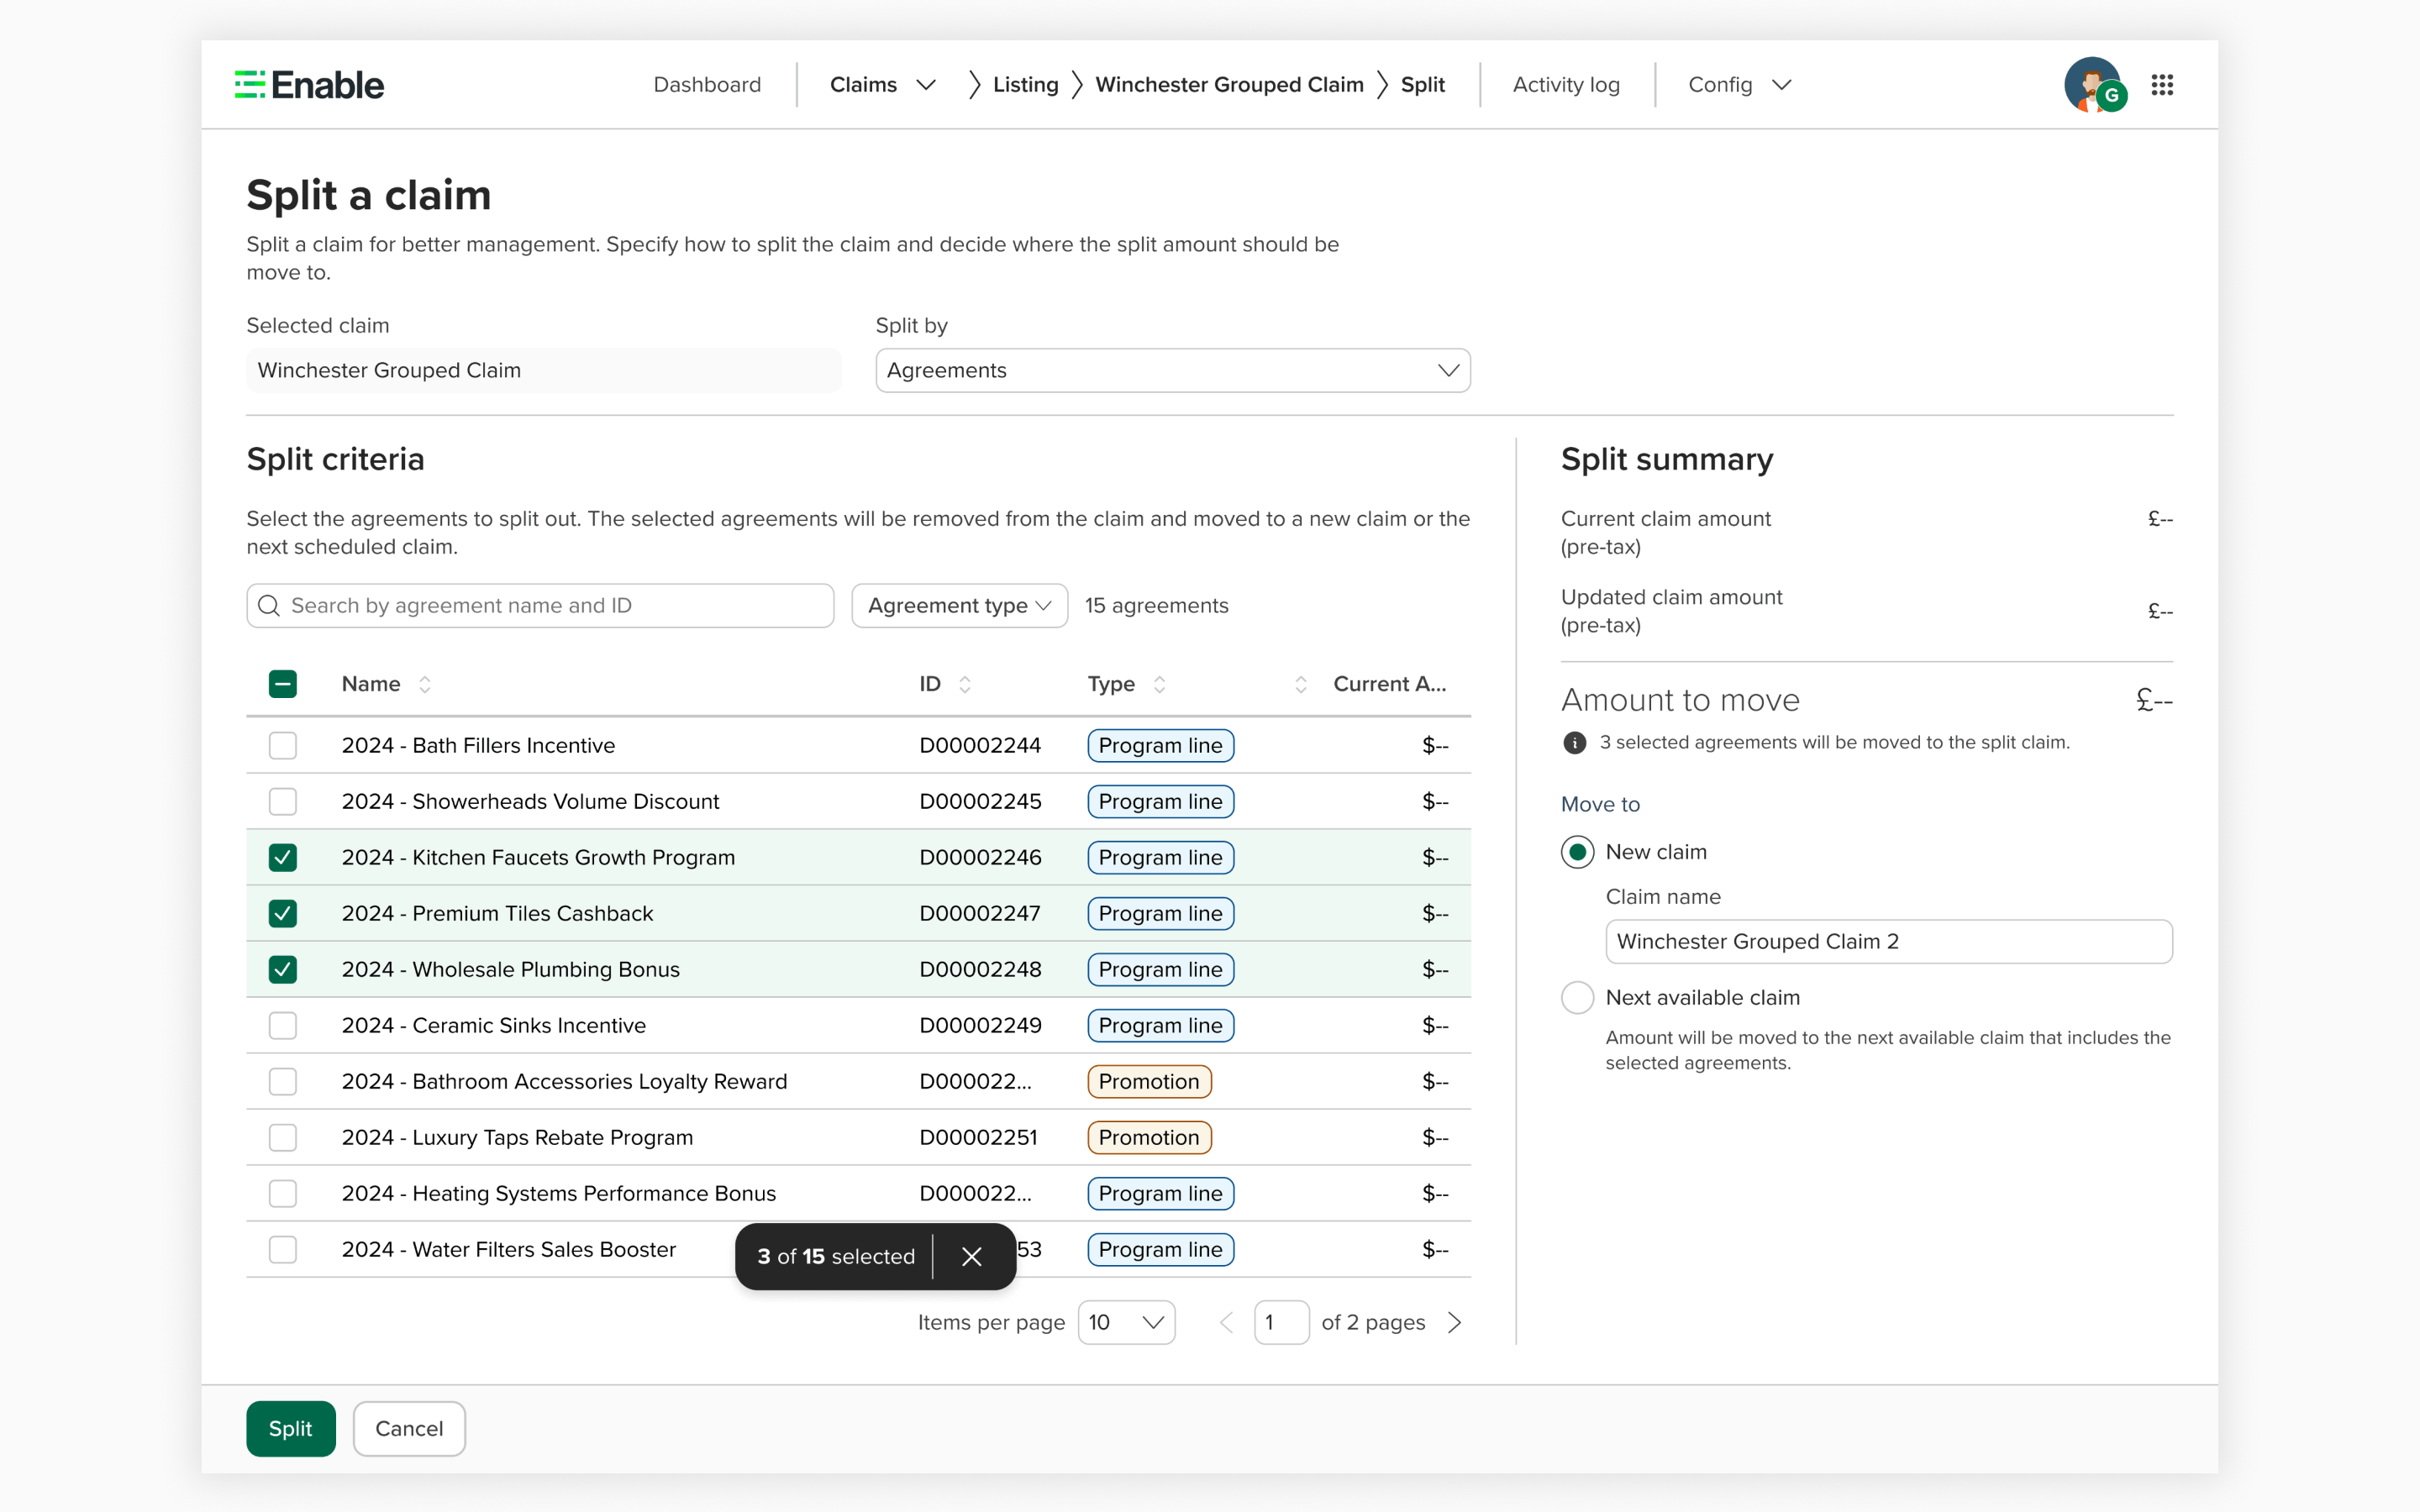
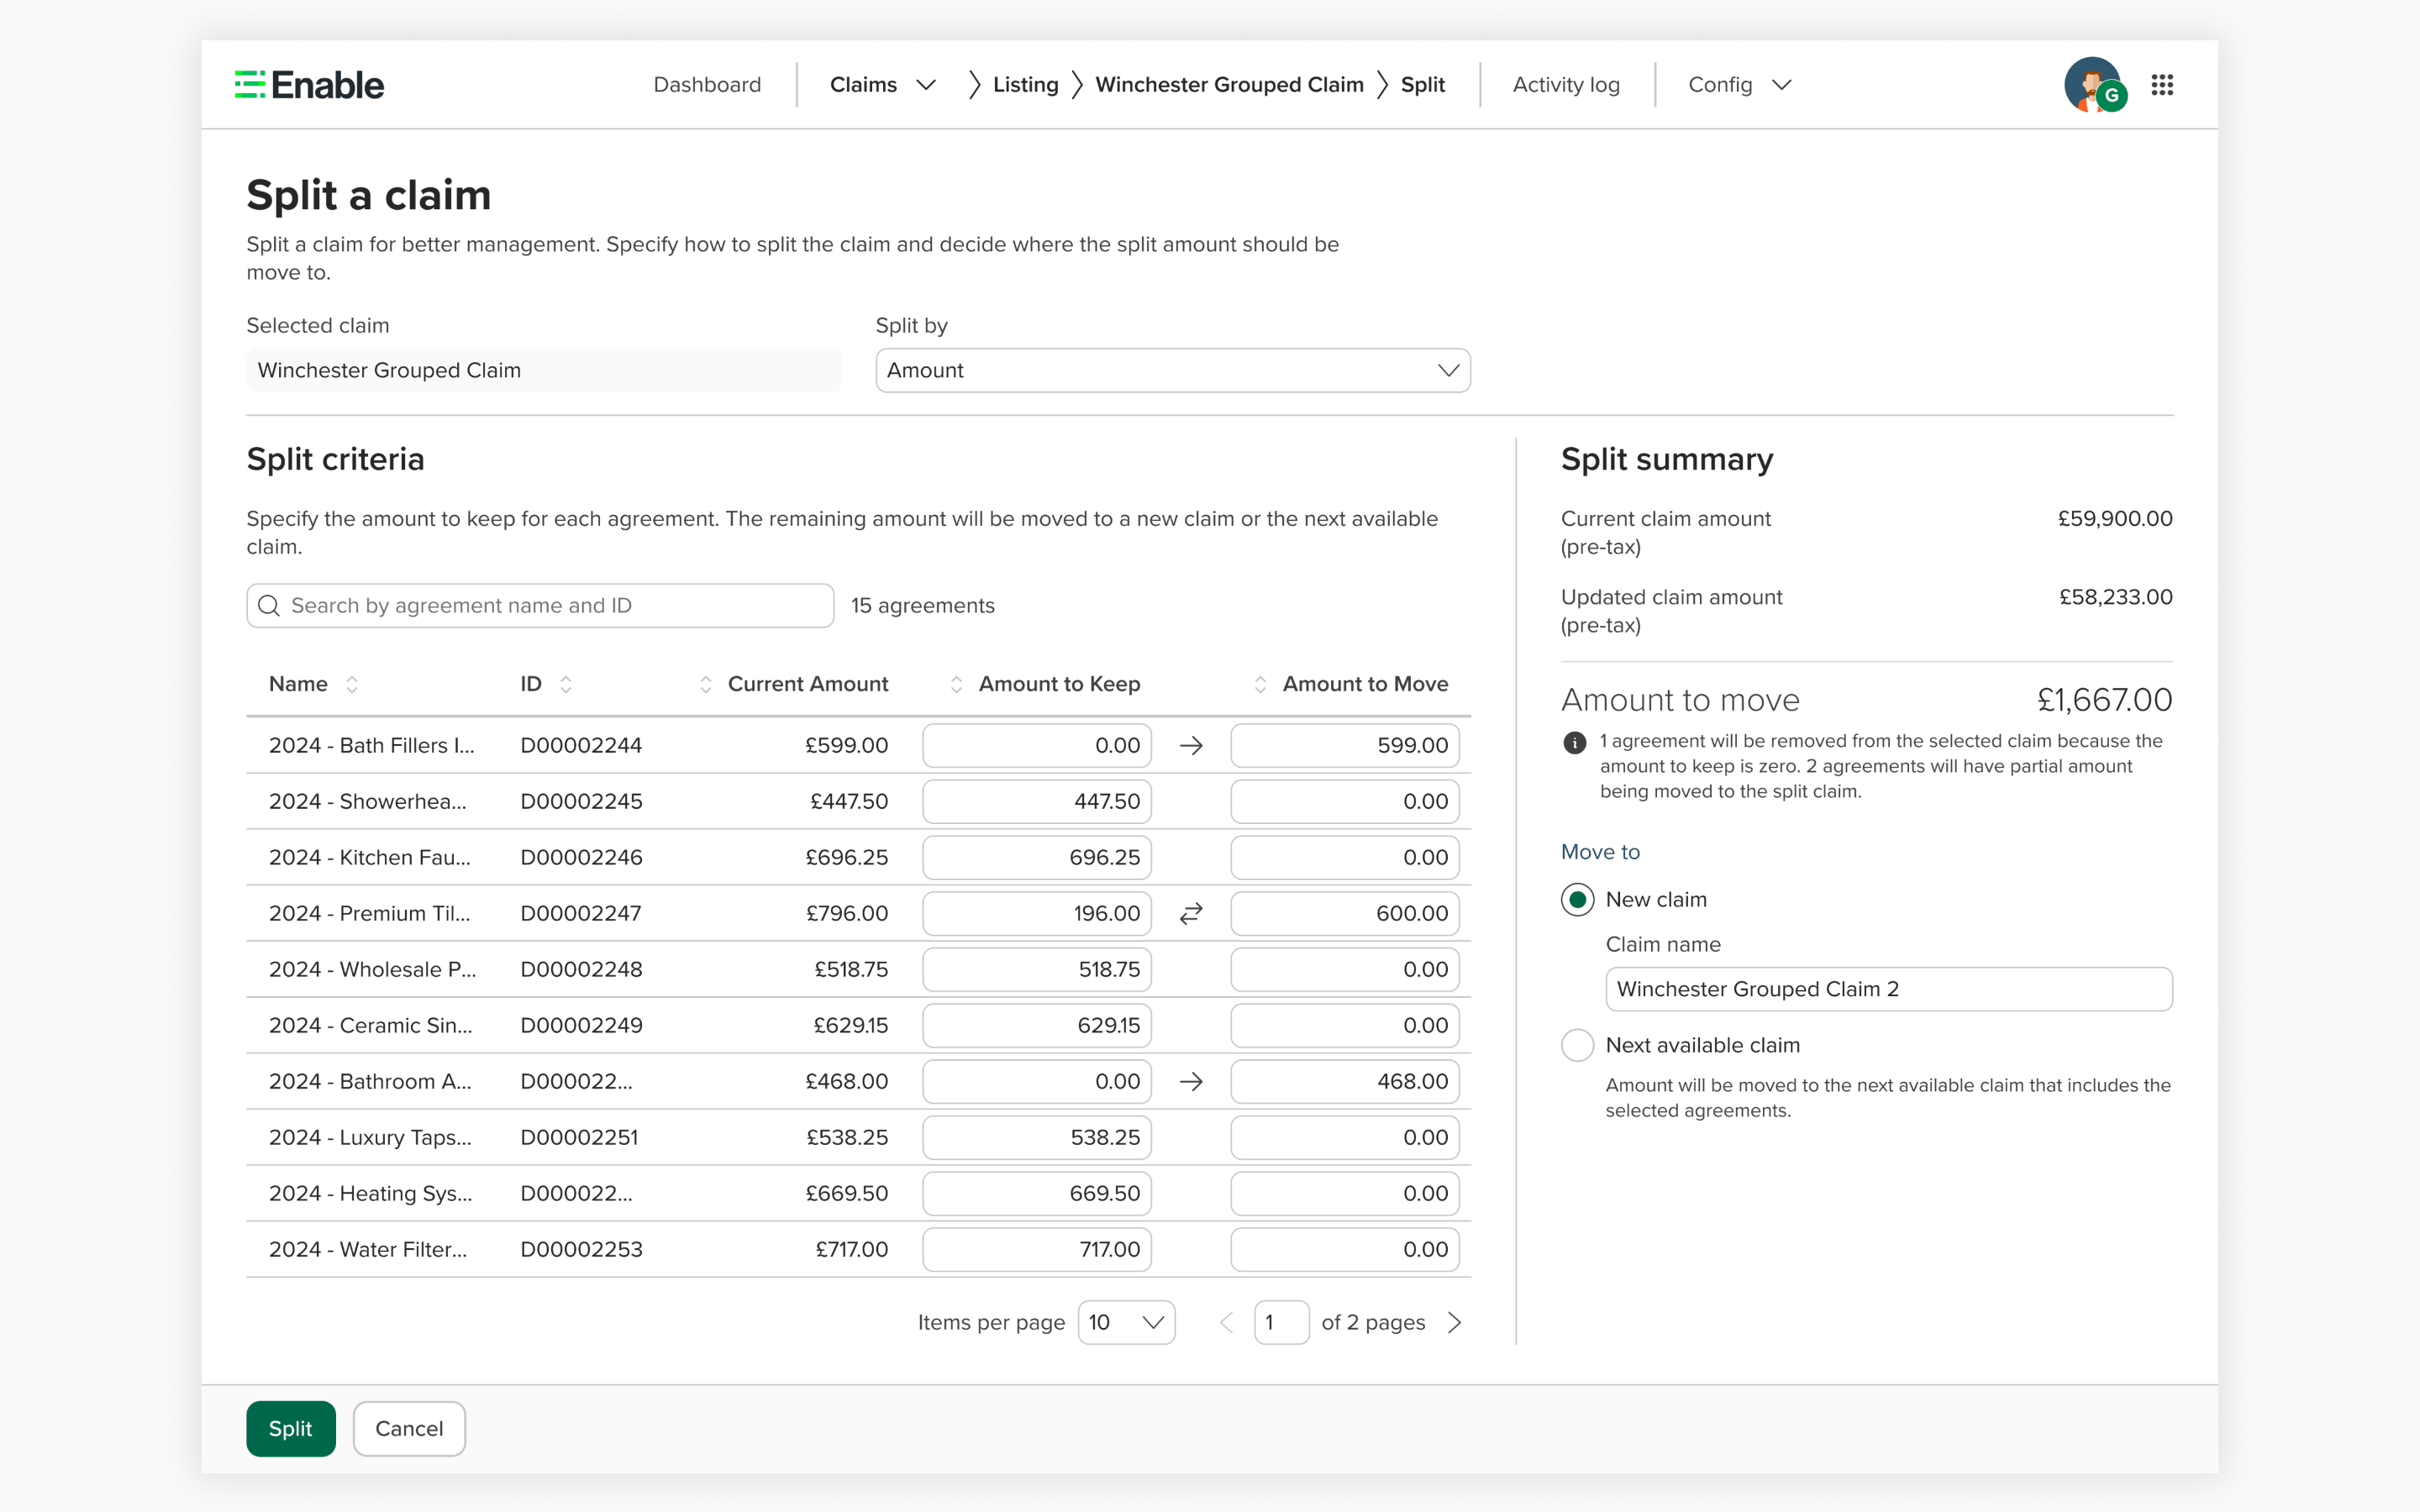
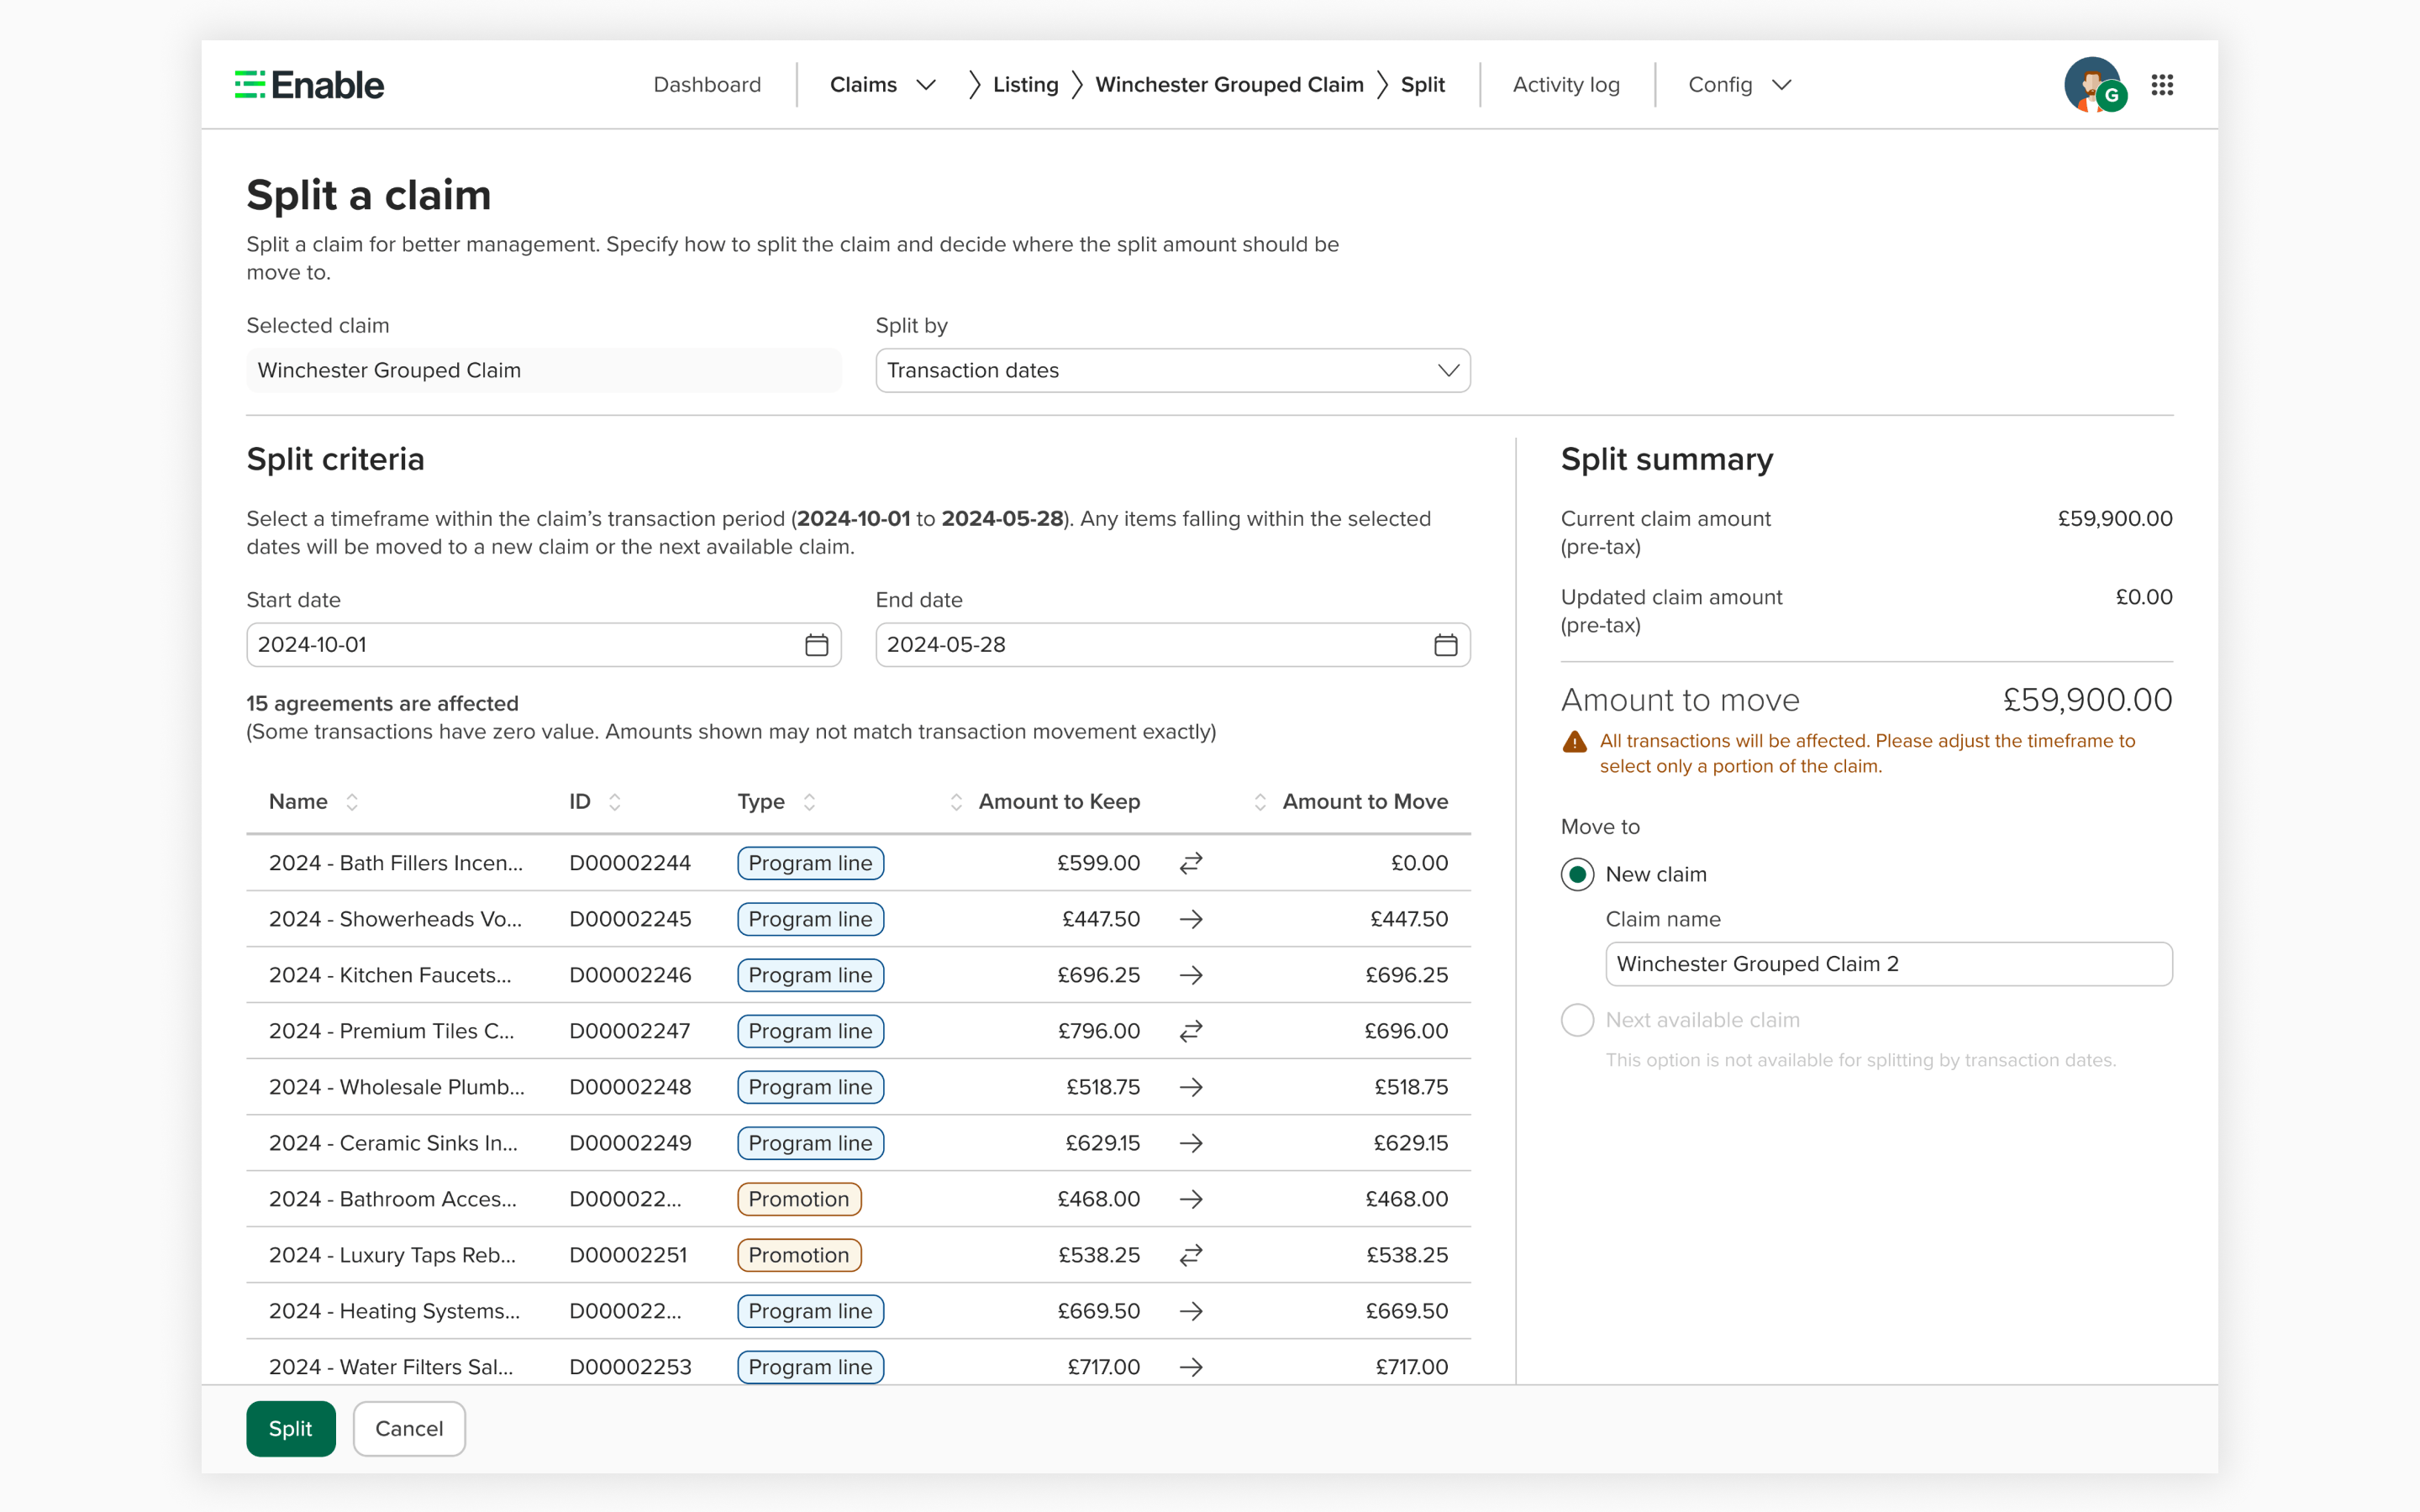
Claim Splitting
The #1 customer request. Previously, a claim with hundreds of agreements was one monolithic block — no way to break it apart. We delivered splitting in three phased releases: split by agreement (move individual agreements between claims), split by amount (adjust specific amounts), and split by transaction date (split based on financial cutoff dates).
Split by agreement — selecting individual agreements to move to a new or existing claim
02
Operational Efficiency
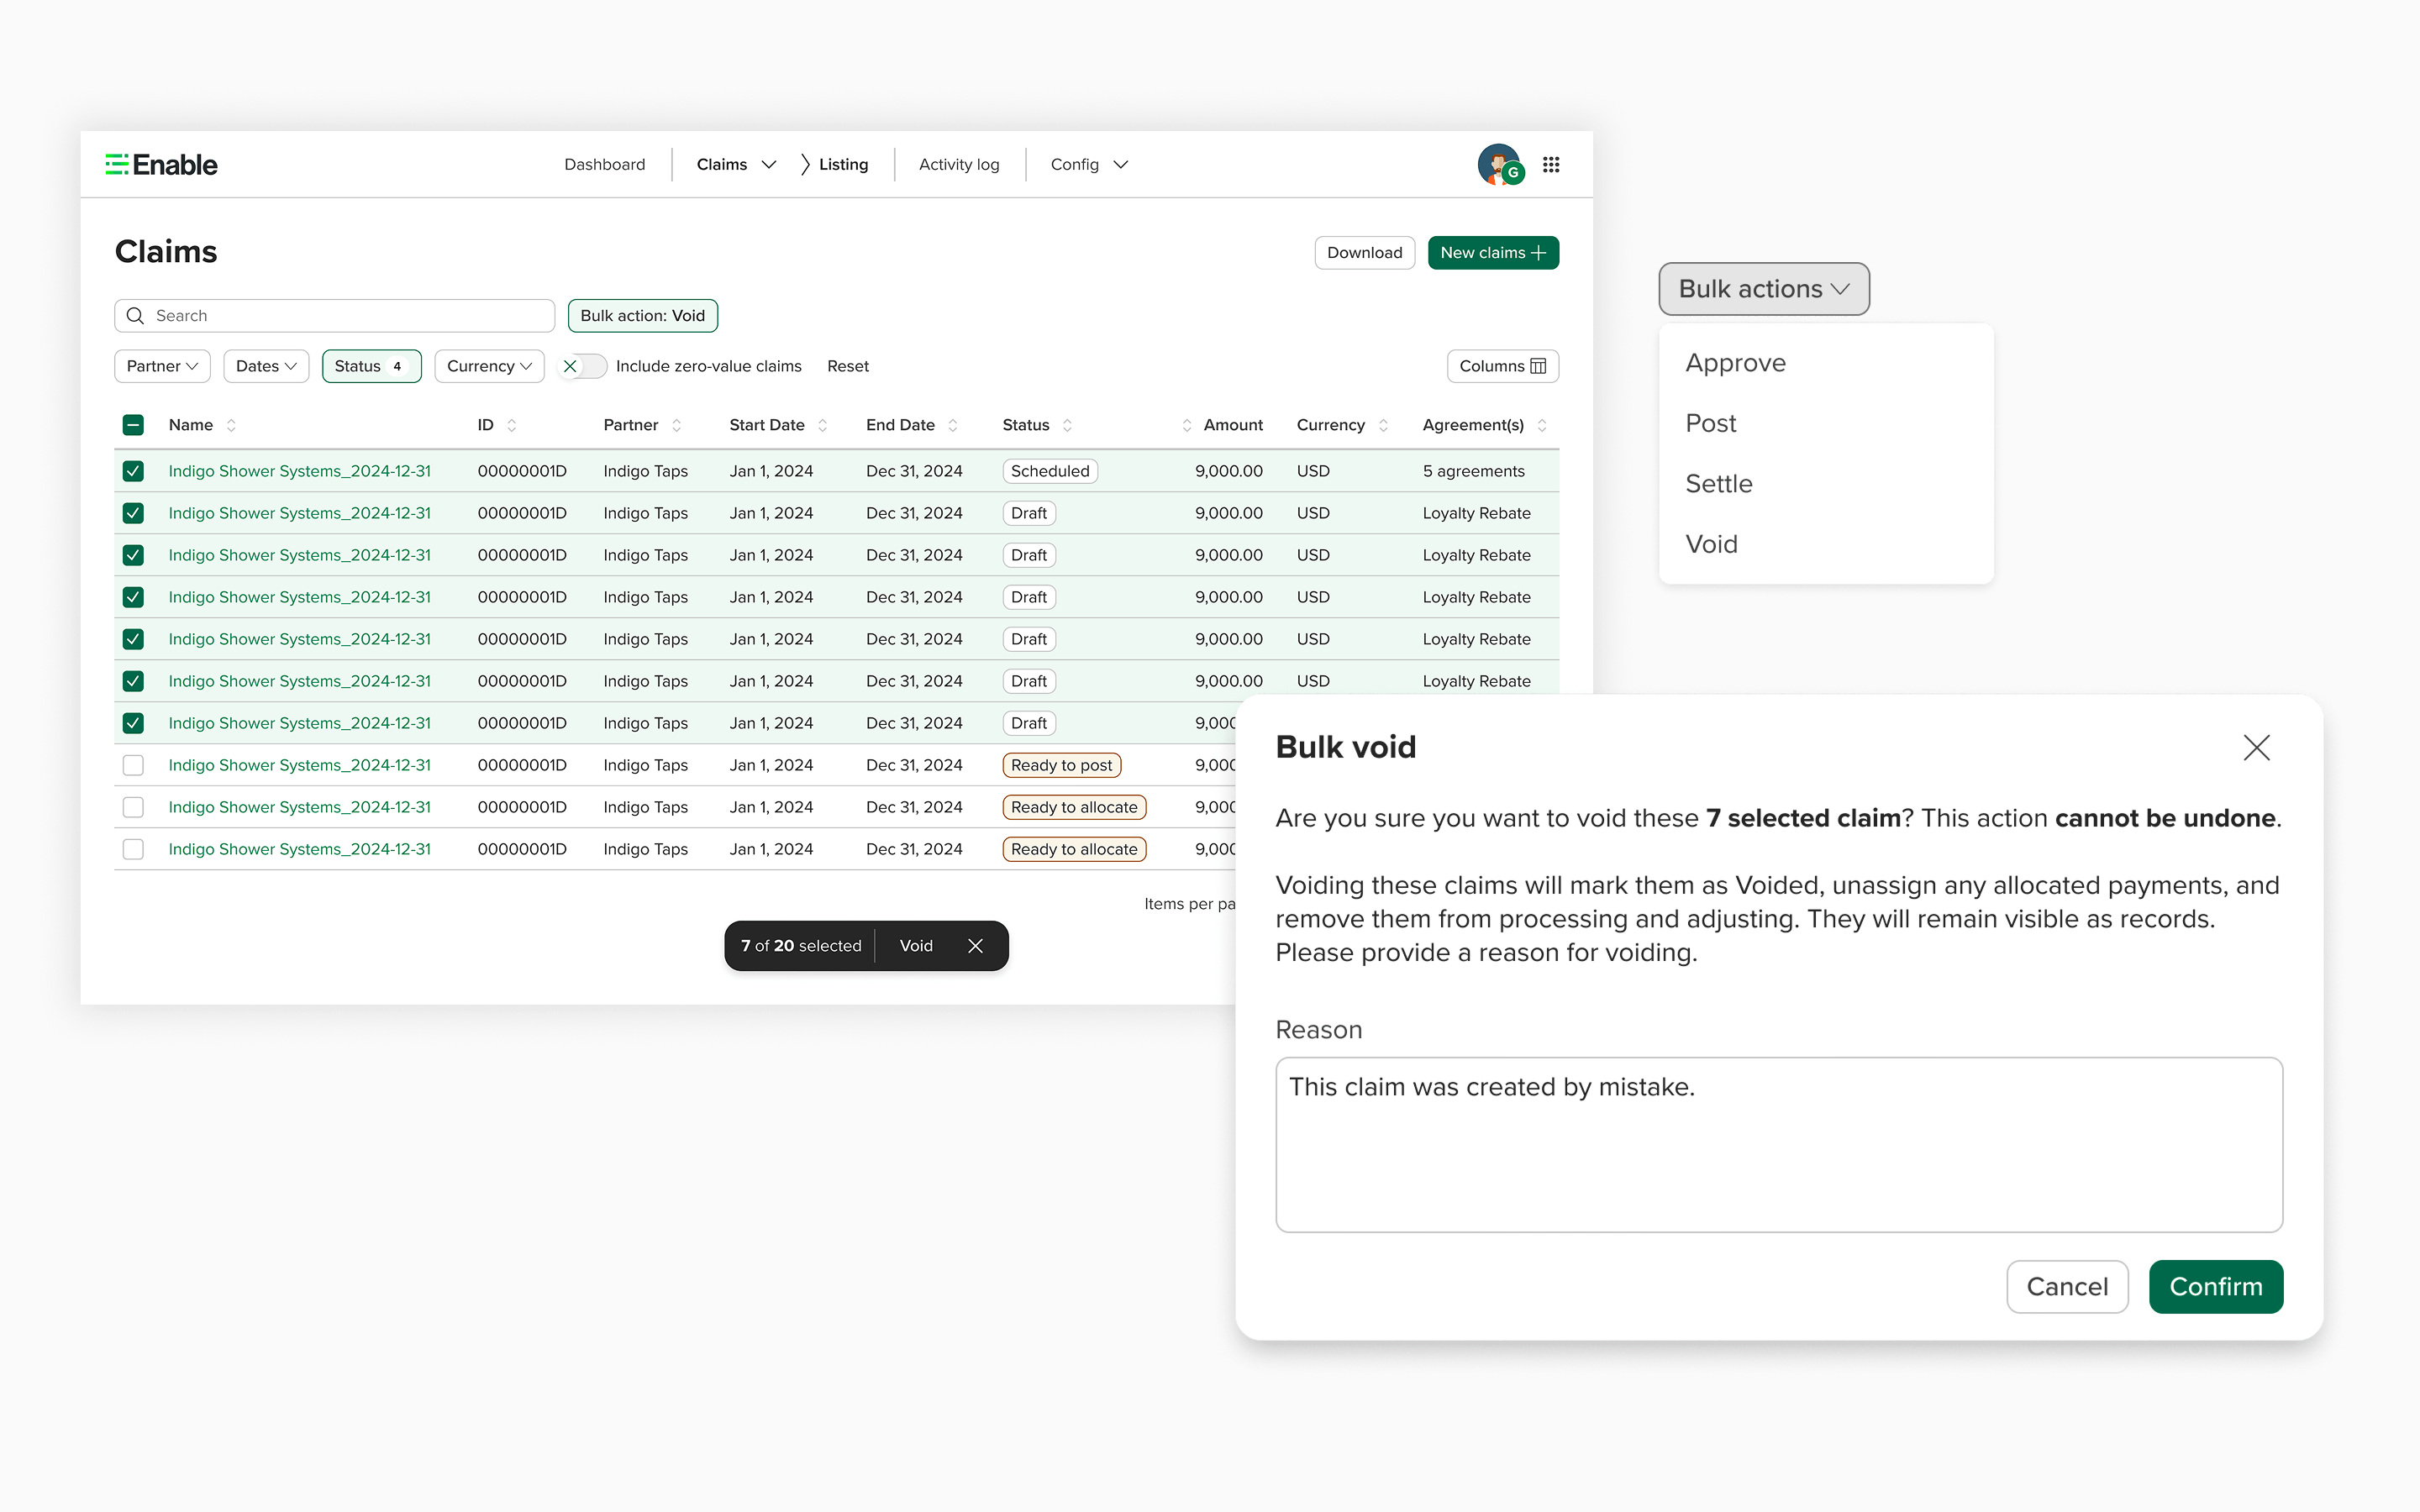
Listing Redesign & Bulk Actions
Redesigned the claims listing page for consistency and added bulk operations — approve, post, settle, and void multiple claims at once. Users no longer had to open each claim individually for common actions, reducing manual effort dramatically.
Click to expand
Redesigned listing page with bulk action toolbar — select multiple claims and apply actions in one step
03
Complete Payment Lifecycle
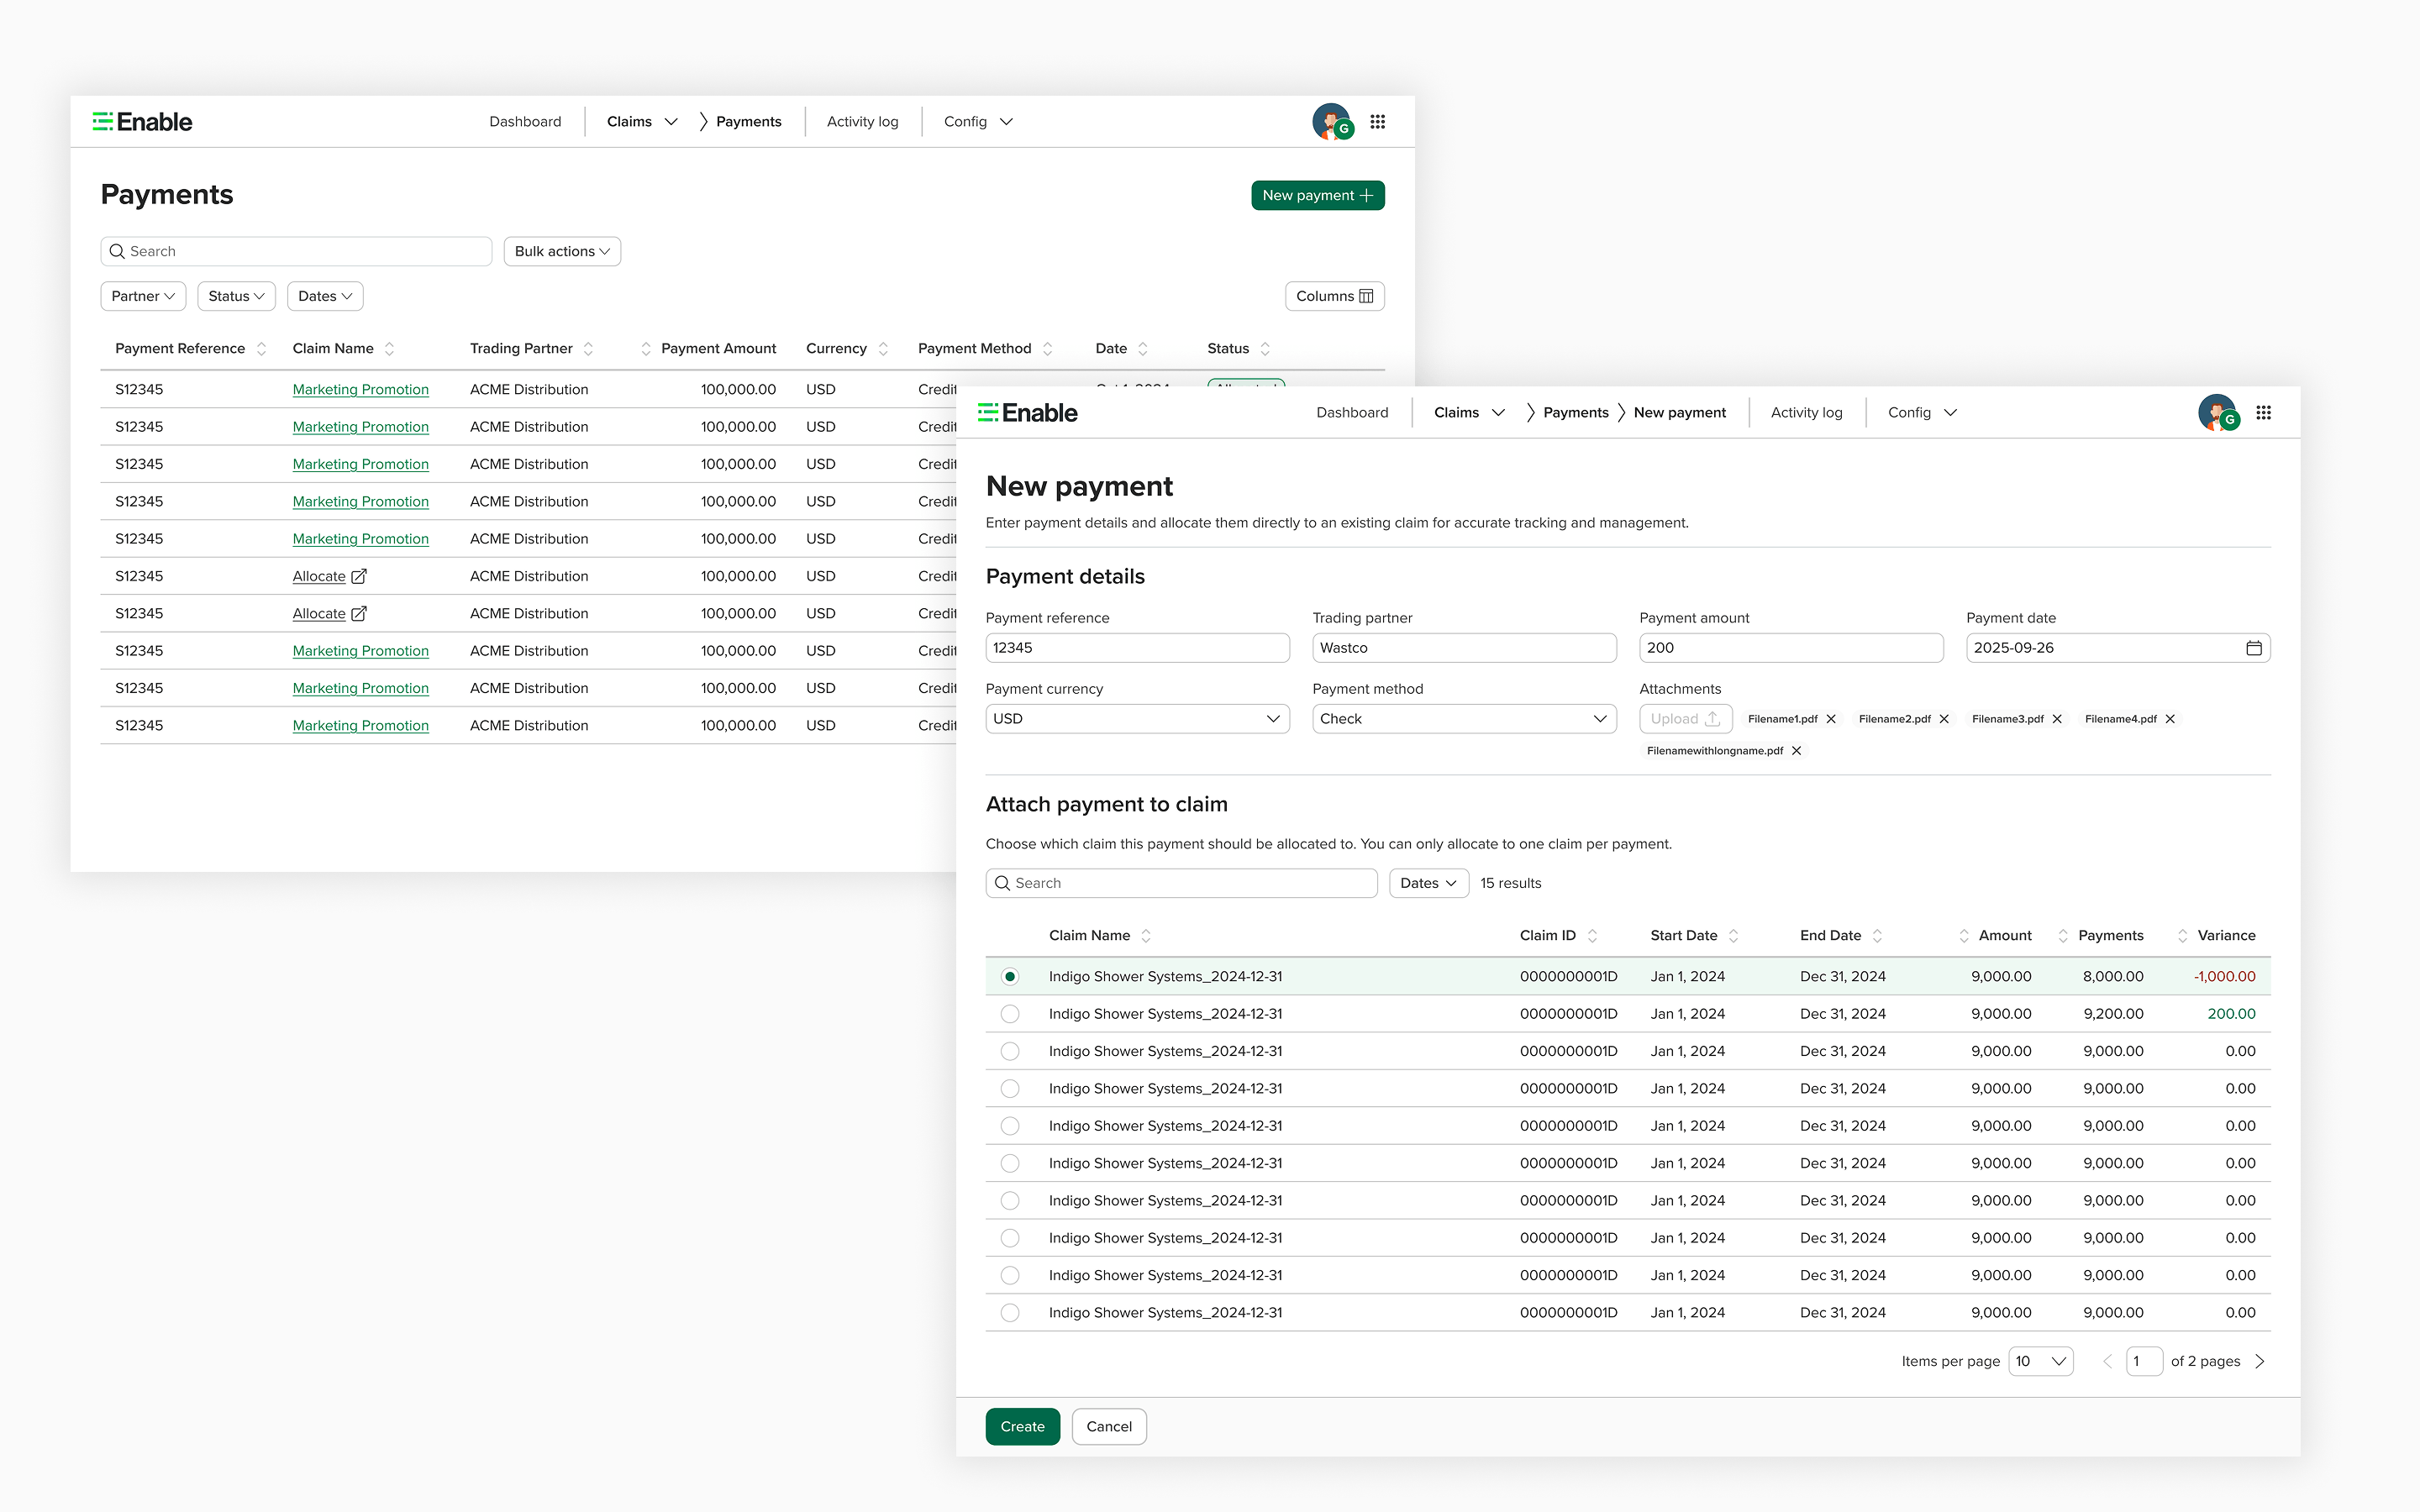
Payments Workflow
The existing payments feature only allowed adding a payment to a claim — no editing, no managing. I redesigned the full receive-and-allocate workflow to support the complete payment lifecycle, serving the customer segment that settles within Enable rather than via ERP.
Click to expand
04
Trading Partner Communication
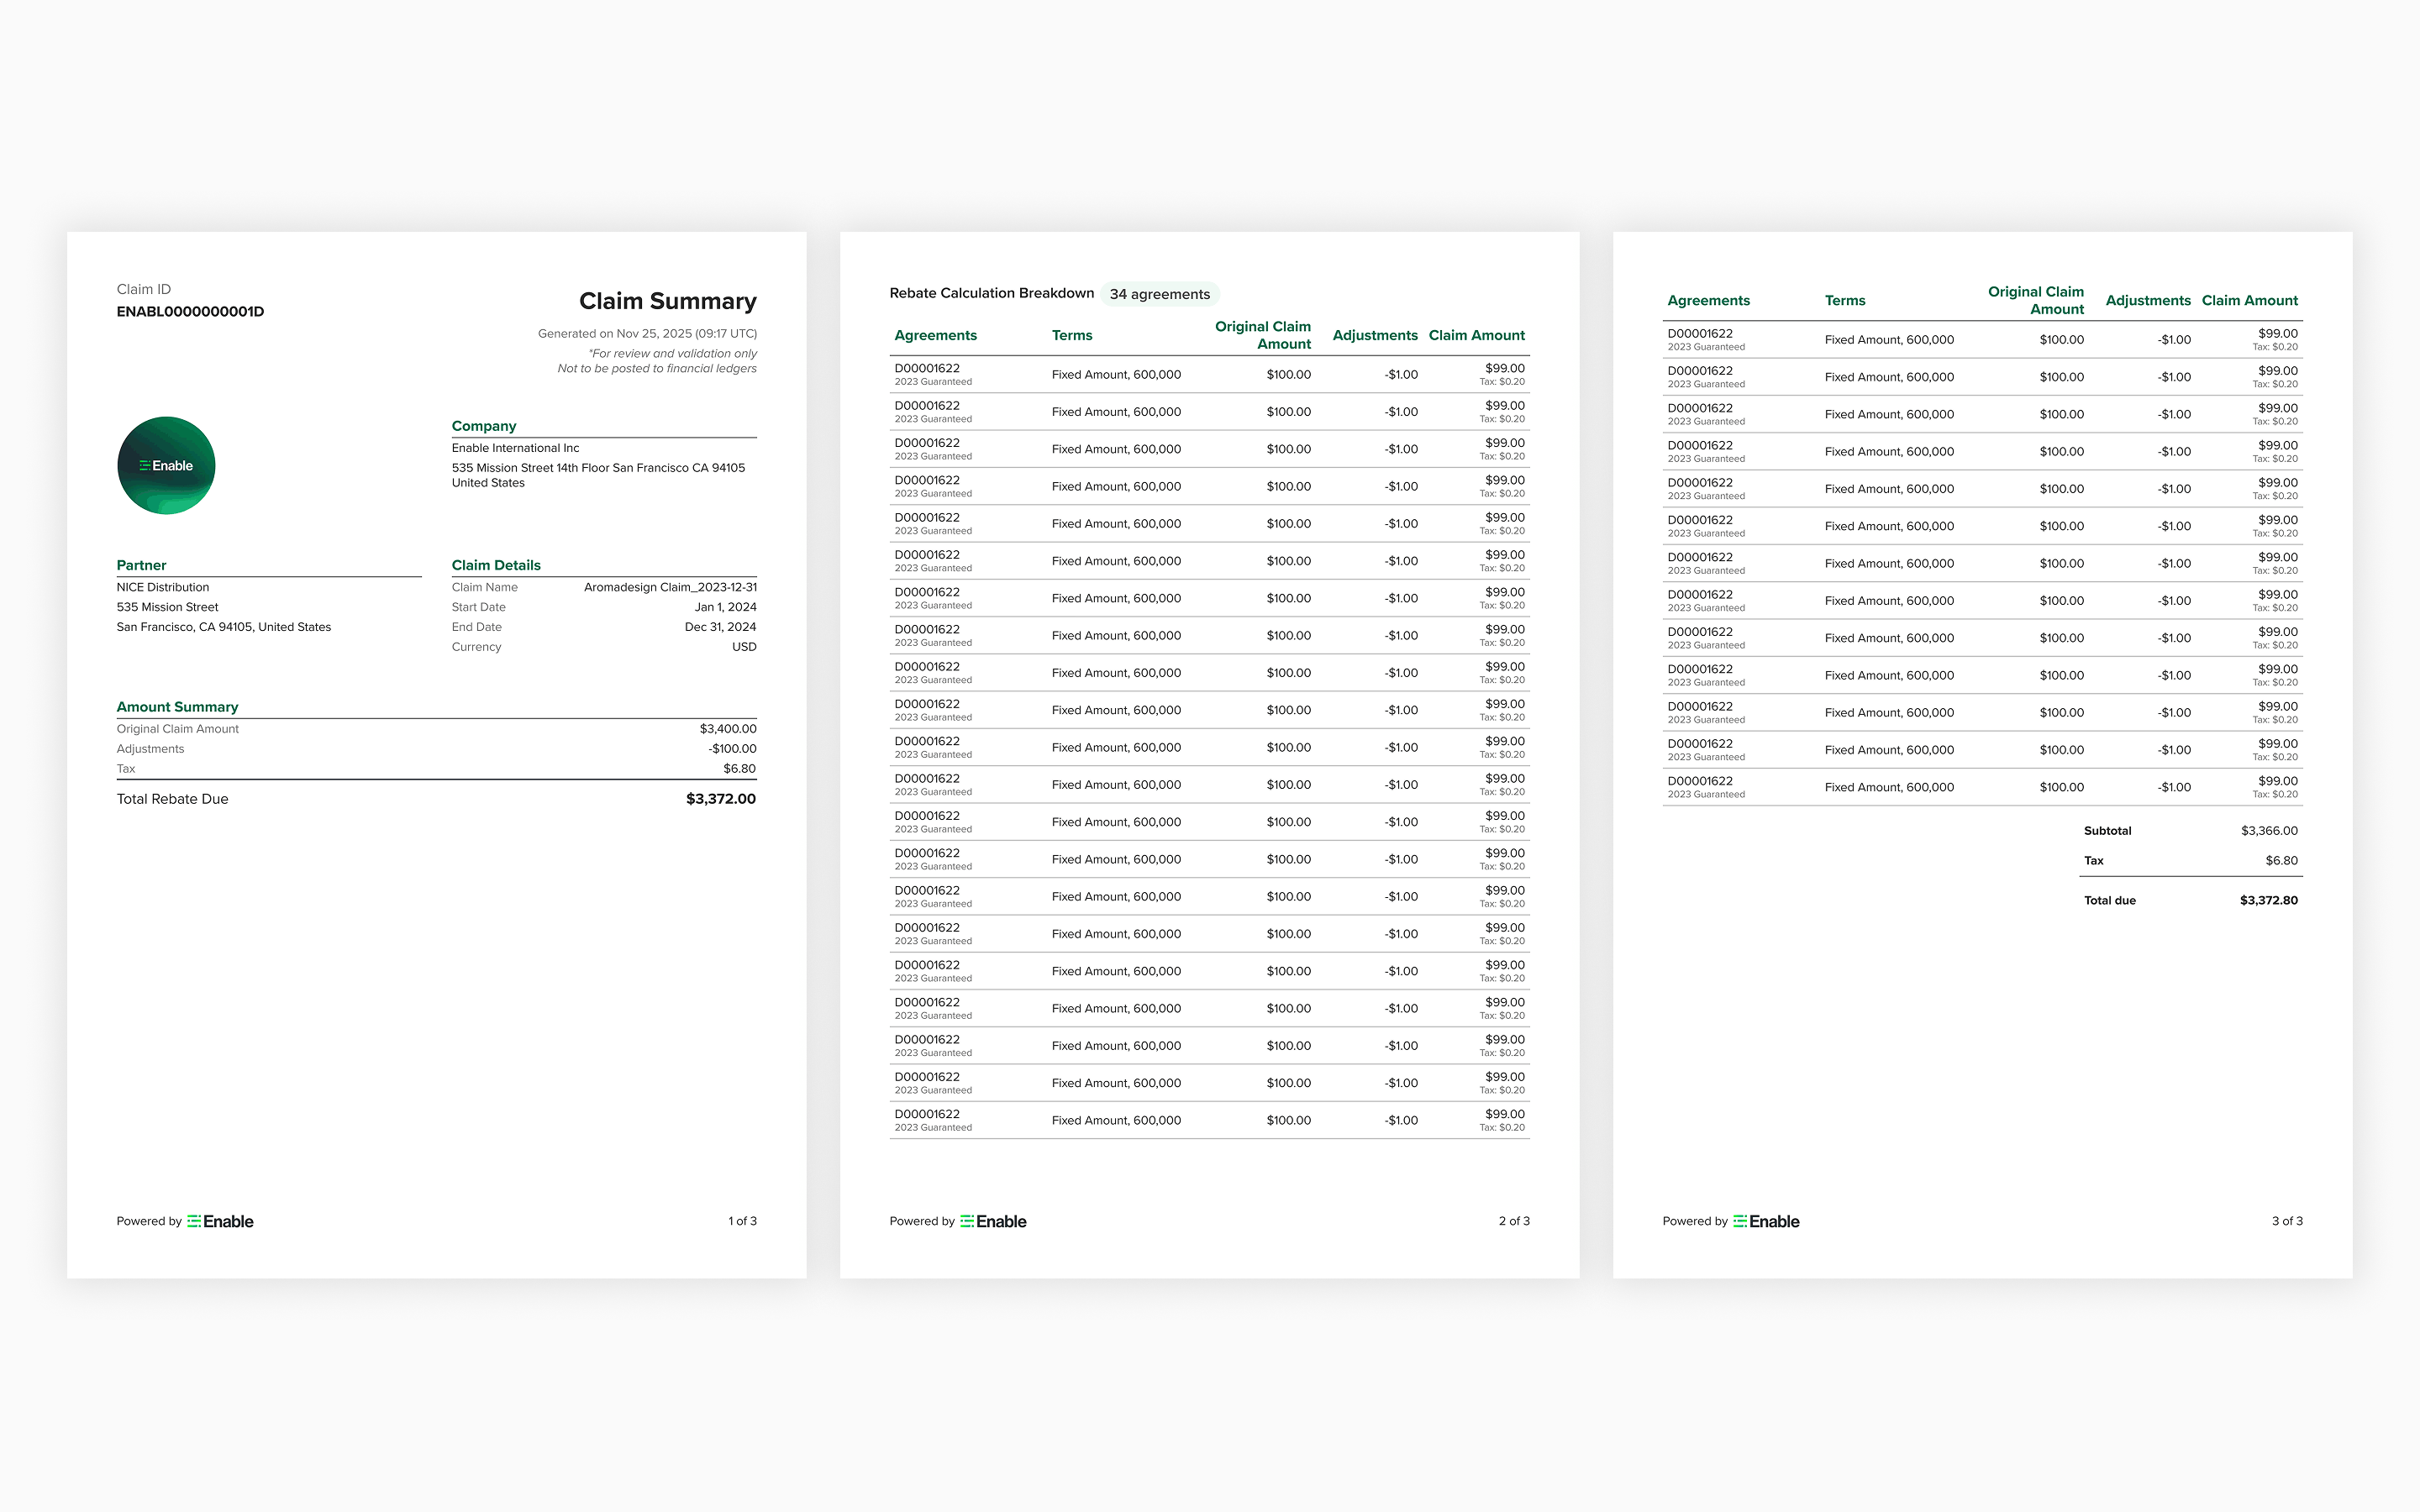
Claim Summary PDF
Designed a pro forma invoice document — a claim summary PDF that captures all claim details for trading partner sign-off before the approval process begins. Previously, customers had no standardized way to share claim details with their partners.
Click to expand
05
Data Customization
File Template System
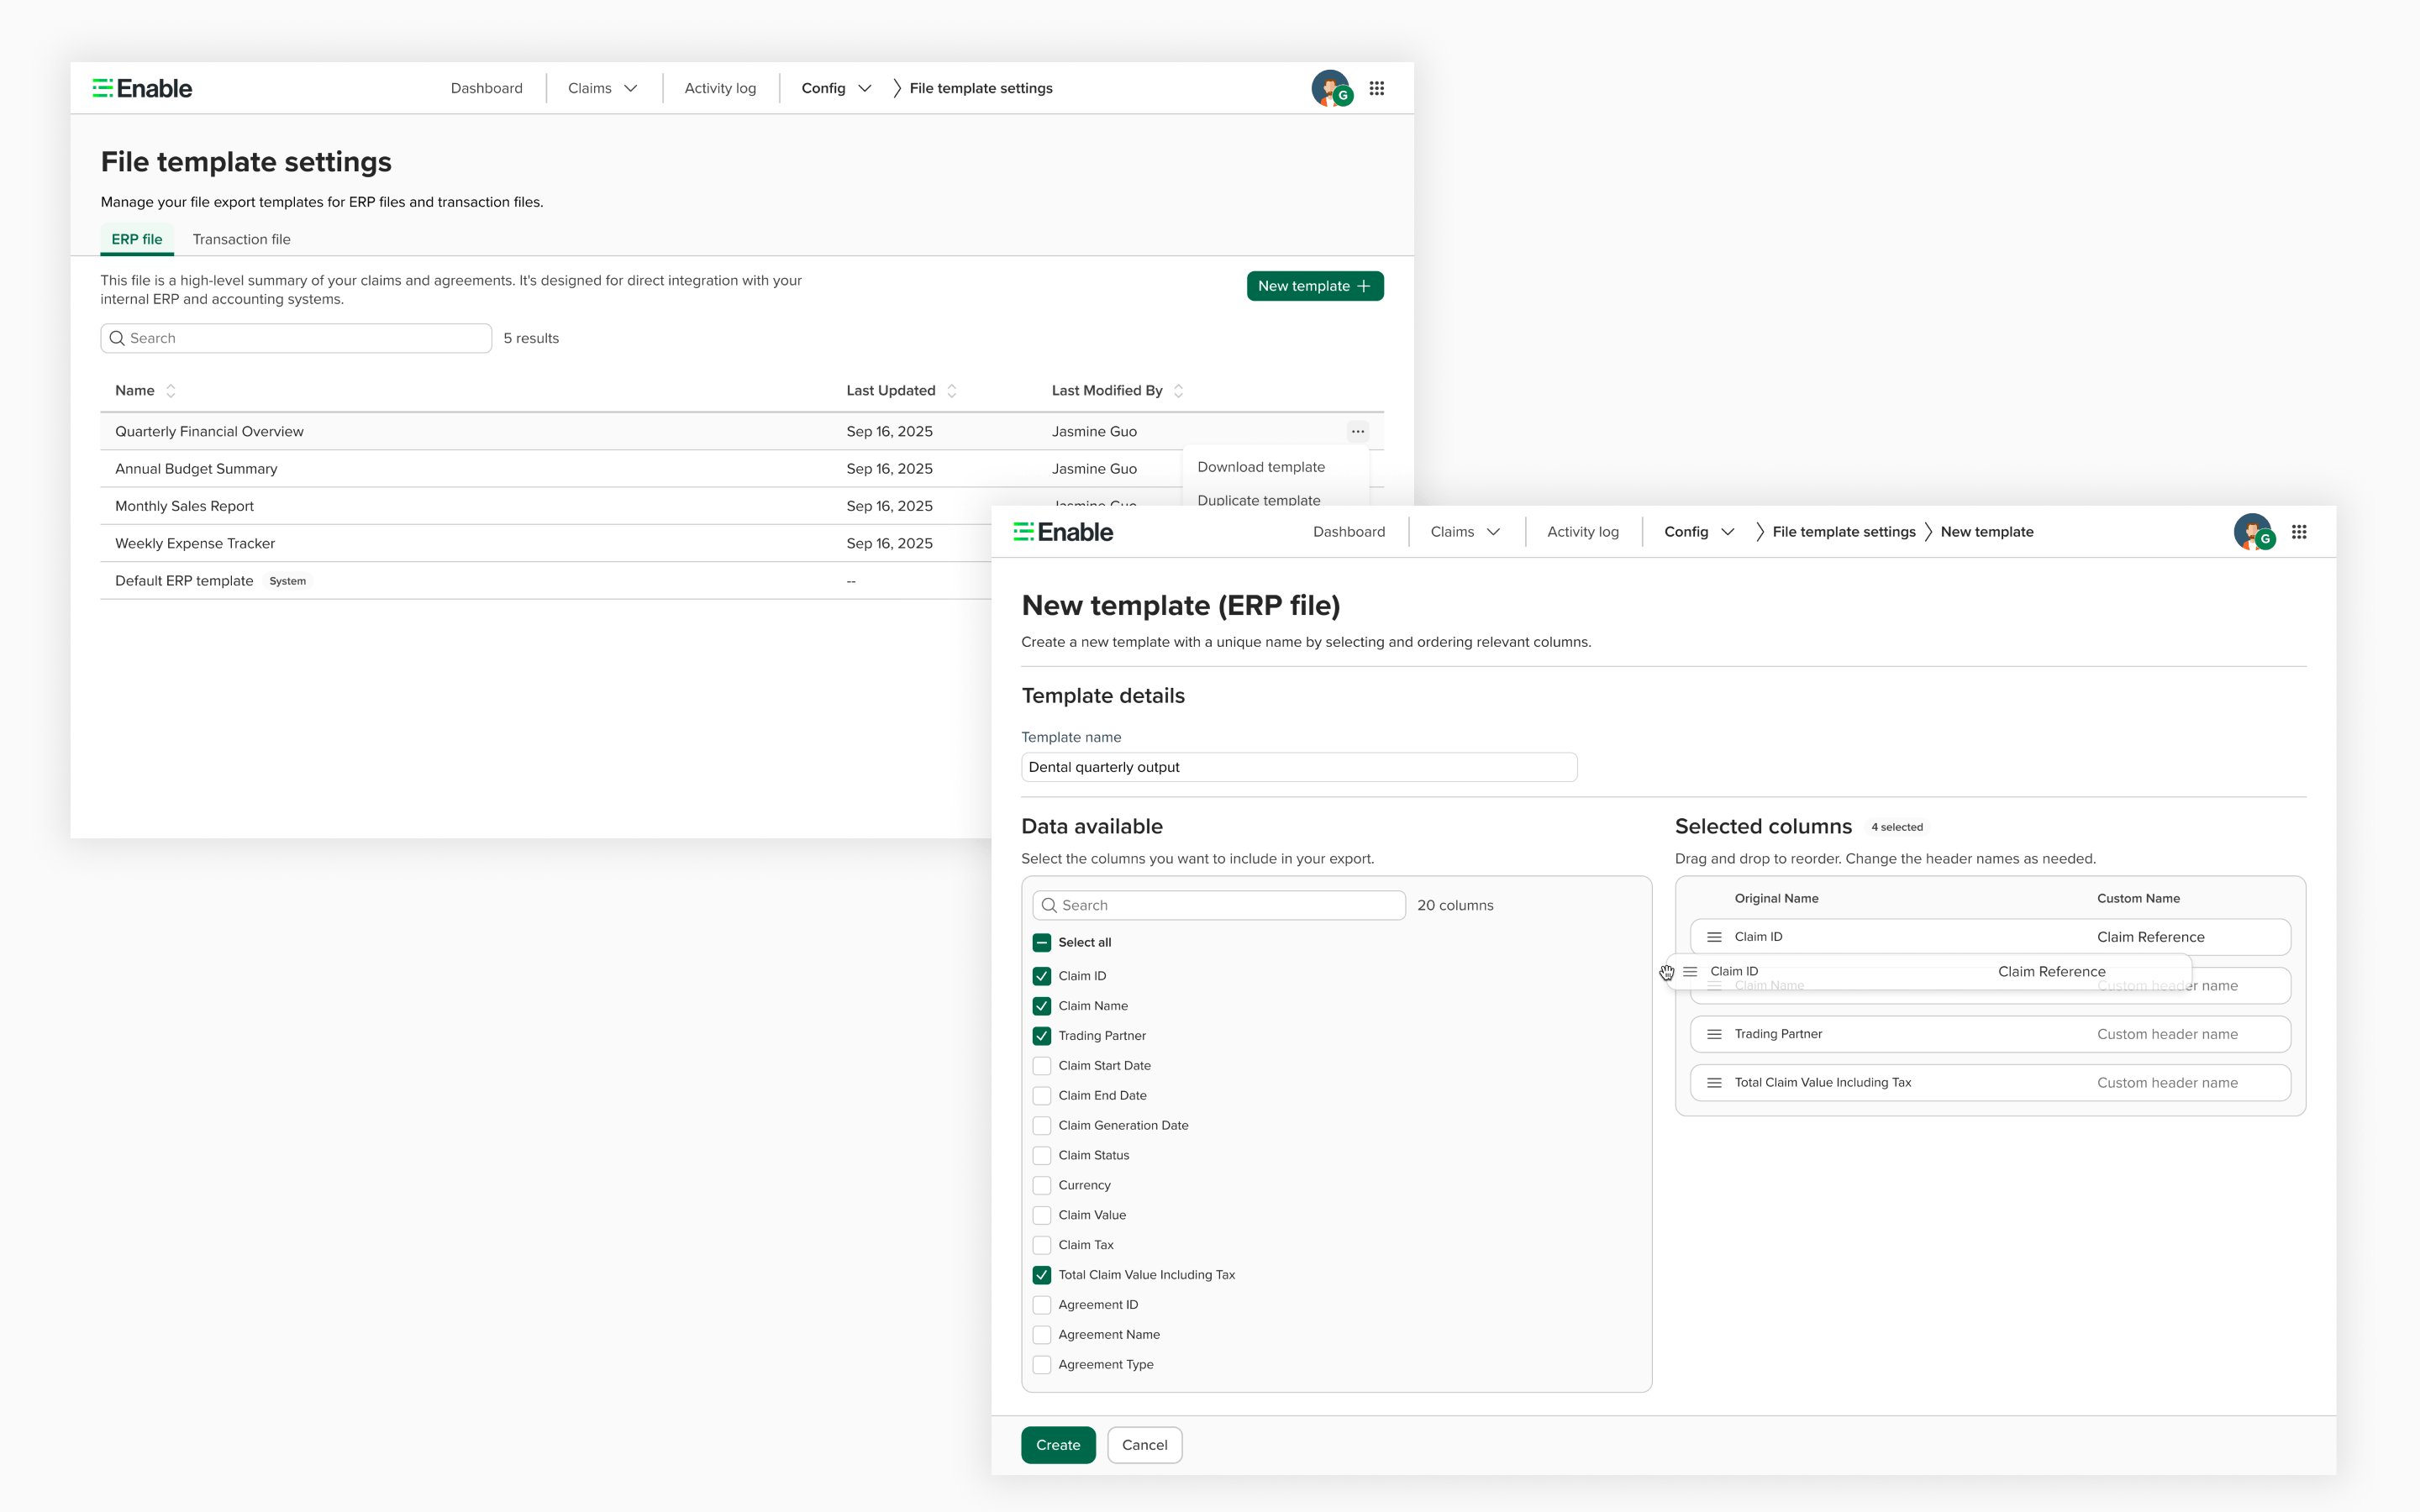
Previously, transaction files and ERP output files had fixed data parameters — every partner got the same format. I designed a template system where users can create custom templates, choose which data fields to include, and assign templates via the settings hierarchy to specific trading partners or agreement types.
Click to expand
Template creation interface — users configure which data fields to include, then assign templates via the settings hierarchy
06
Traceability & Operations
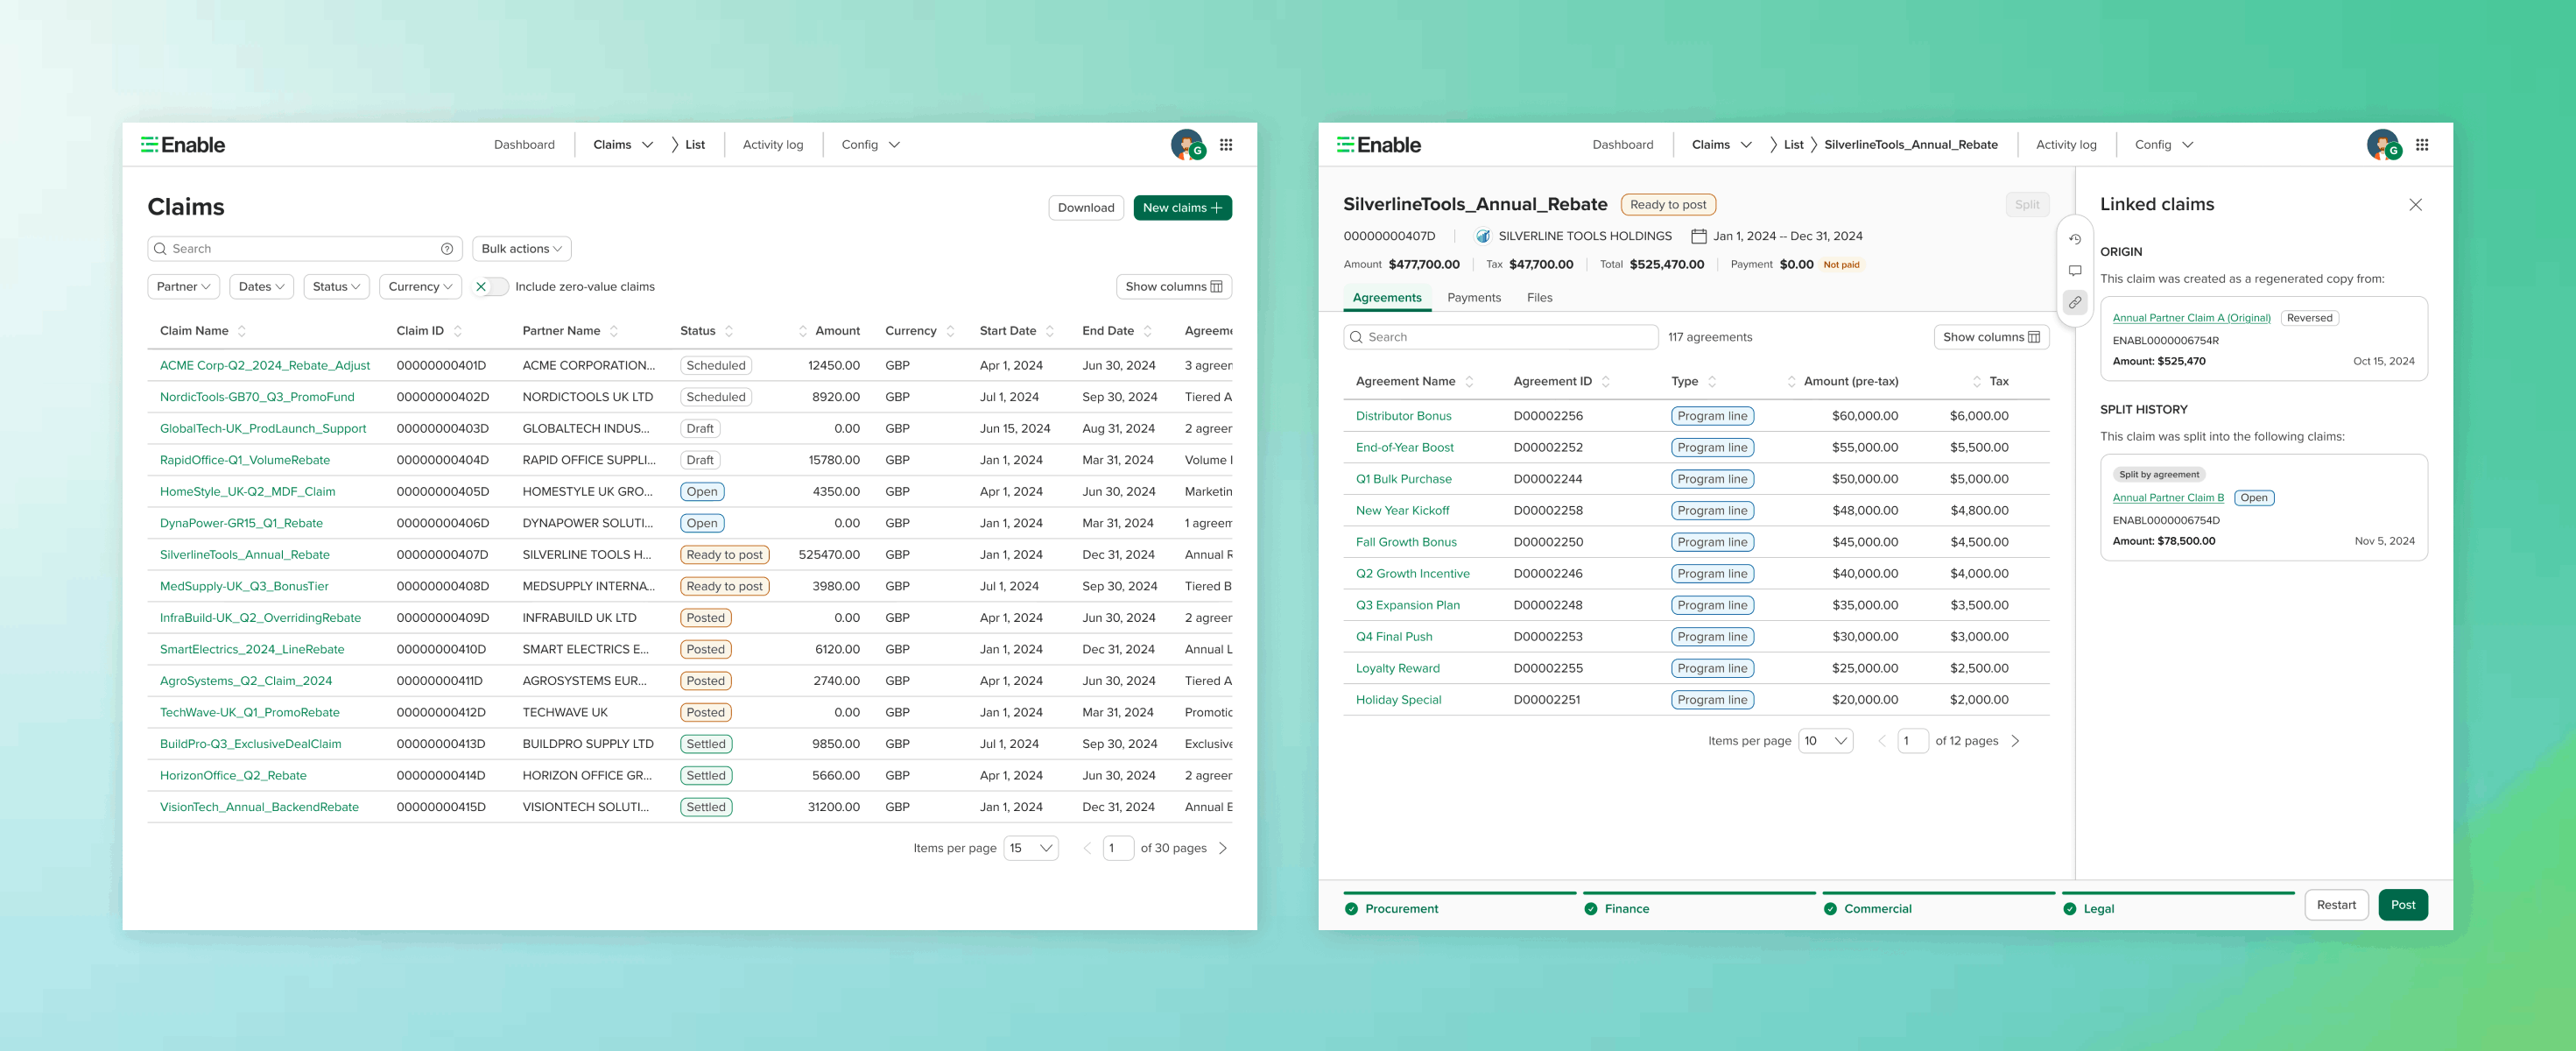
Linked Claims, Reversal & Unique IDs
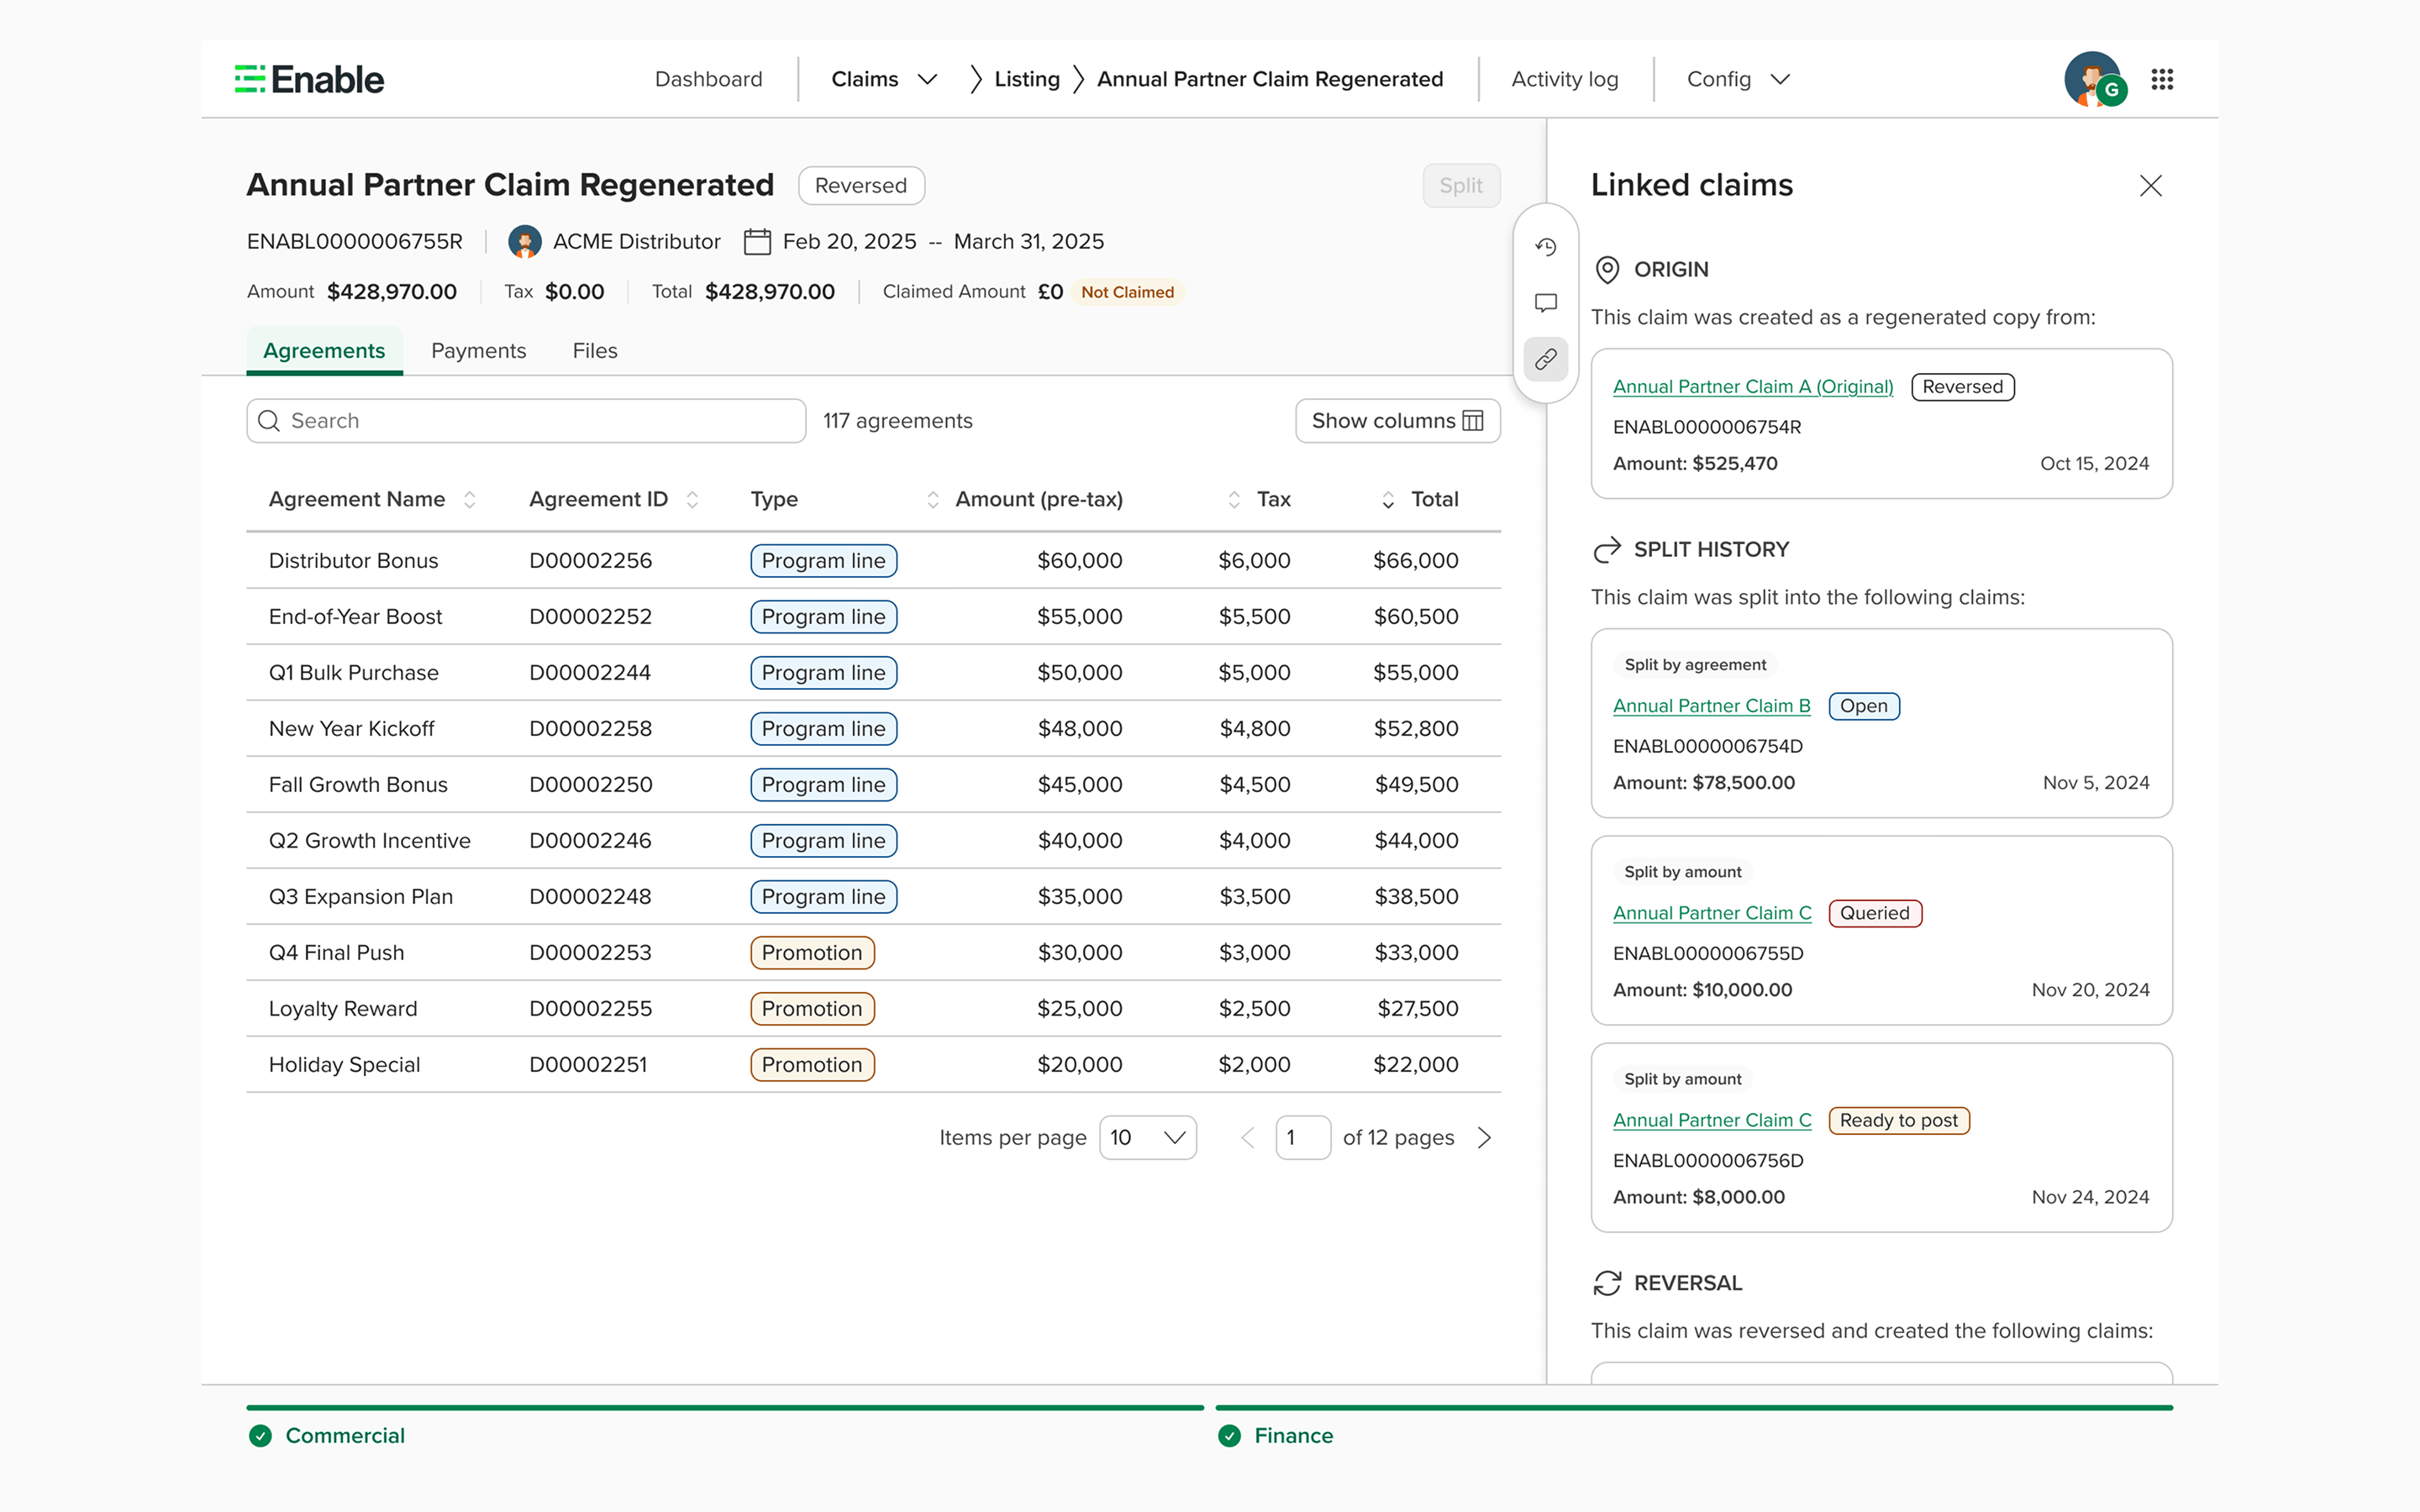
Three features that complete the operational picture: Linked Claims shows relationships between claims (split origins, reversals) — born from a 2-day hackathon with engineers. Reversal lets users undo claims when mistakes happen. Unique IDs replaced cryptic GUIDs with human-readable identifiers.
Click to expand
Linked claims — tracing the full history of a claim: where it was split from, what it was reversed into, and related claims
Validation
Measuring the shift — before and after
Throughout the redesign and feature rollouts, I tracked feedback through multiple channels to validate that the design decisions were working — and to course-correct when they weren't.
Quantitative signals
Product intake tickets dropped significantly — the same pain points that dominated the backlog before the redesign (no splitting, no bulk actions, no file customization) stopped appearing. New tickets shifted from "this is broken" to "can we add more of this?" — a sign the foundation was working.
Customer adoption increased — before the redesign, enterprise customers were refusing to onboard Claims. After the foundation + splitting launch, onboarding pipeline grew to include Greencross ($128k), HPS ($198k), Vallen ($249k), and BWG Foods ($202k).
FullStory session data improved — the funnel from listing to detail page showed less back-and-forth navigation after the redesign, indicating users could complete tasks on the detail page without hunting for information.
Qualitative feedback
I actively sought feedback after every major release — through CS channels, implementation analyst conversations, and direct customer calls when possible. A few examples:
"The new Claims interface is so much cleaner. We can actually find what we need now."
— Customer feedback, post-foundation redesign
"Splitting changed everything for us. We were doing this manually in spreadsheets before."
— Enterprise customer, post-splitting launch
"The design system components look really polished. This feels like a different product."
— Internal stakeholder feedback
How feedback shaped the roadmap: The validation wasn't just about confirmation. Customer feedback after the splitting launch directly informed the next priorities — users immediately asked for bulk actions on the listing page (shipped Q3) and custom file templates (shipped Q4). Each feature built on what users told us they needed most after the previous release. I used this continuous feedback loop to prioritize my design work and present evidence-based recommendations to the PM.
Design Culture
Building a design practice from scratch
When I joined, the team of 15–20 engineers had never worked with a designer. The challenge wasn't just producing designs — it was building a design culture within a team that had always operated without one.
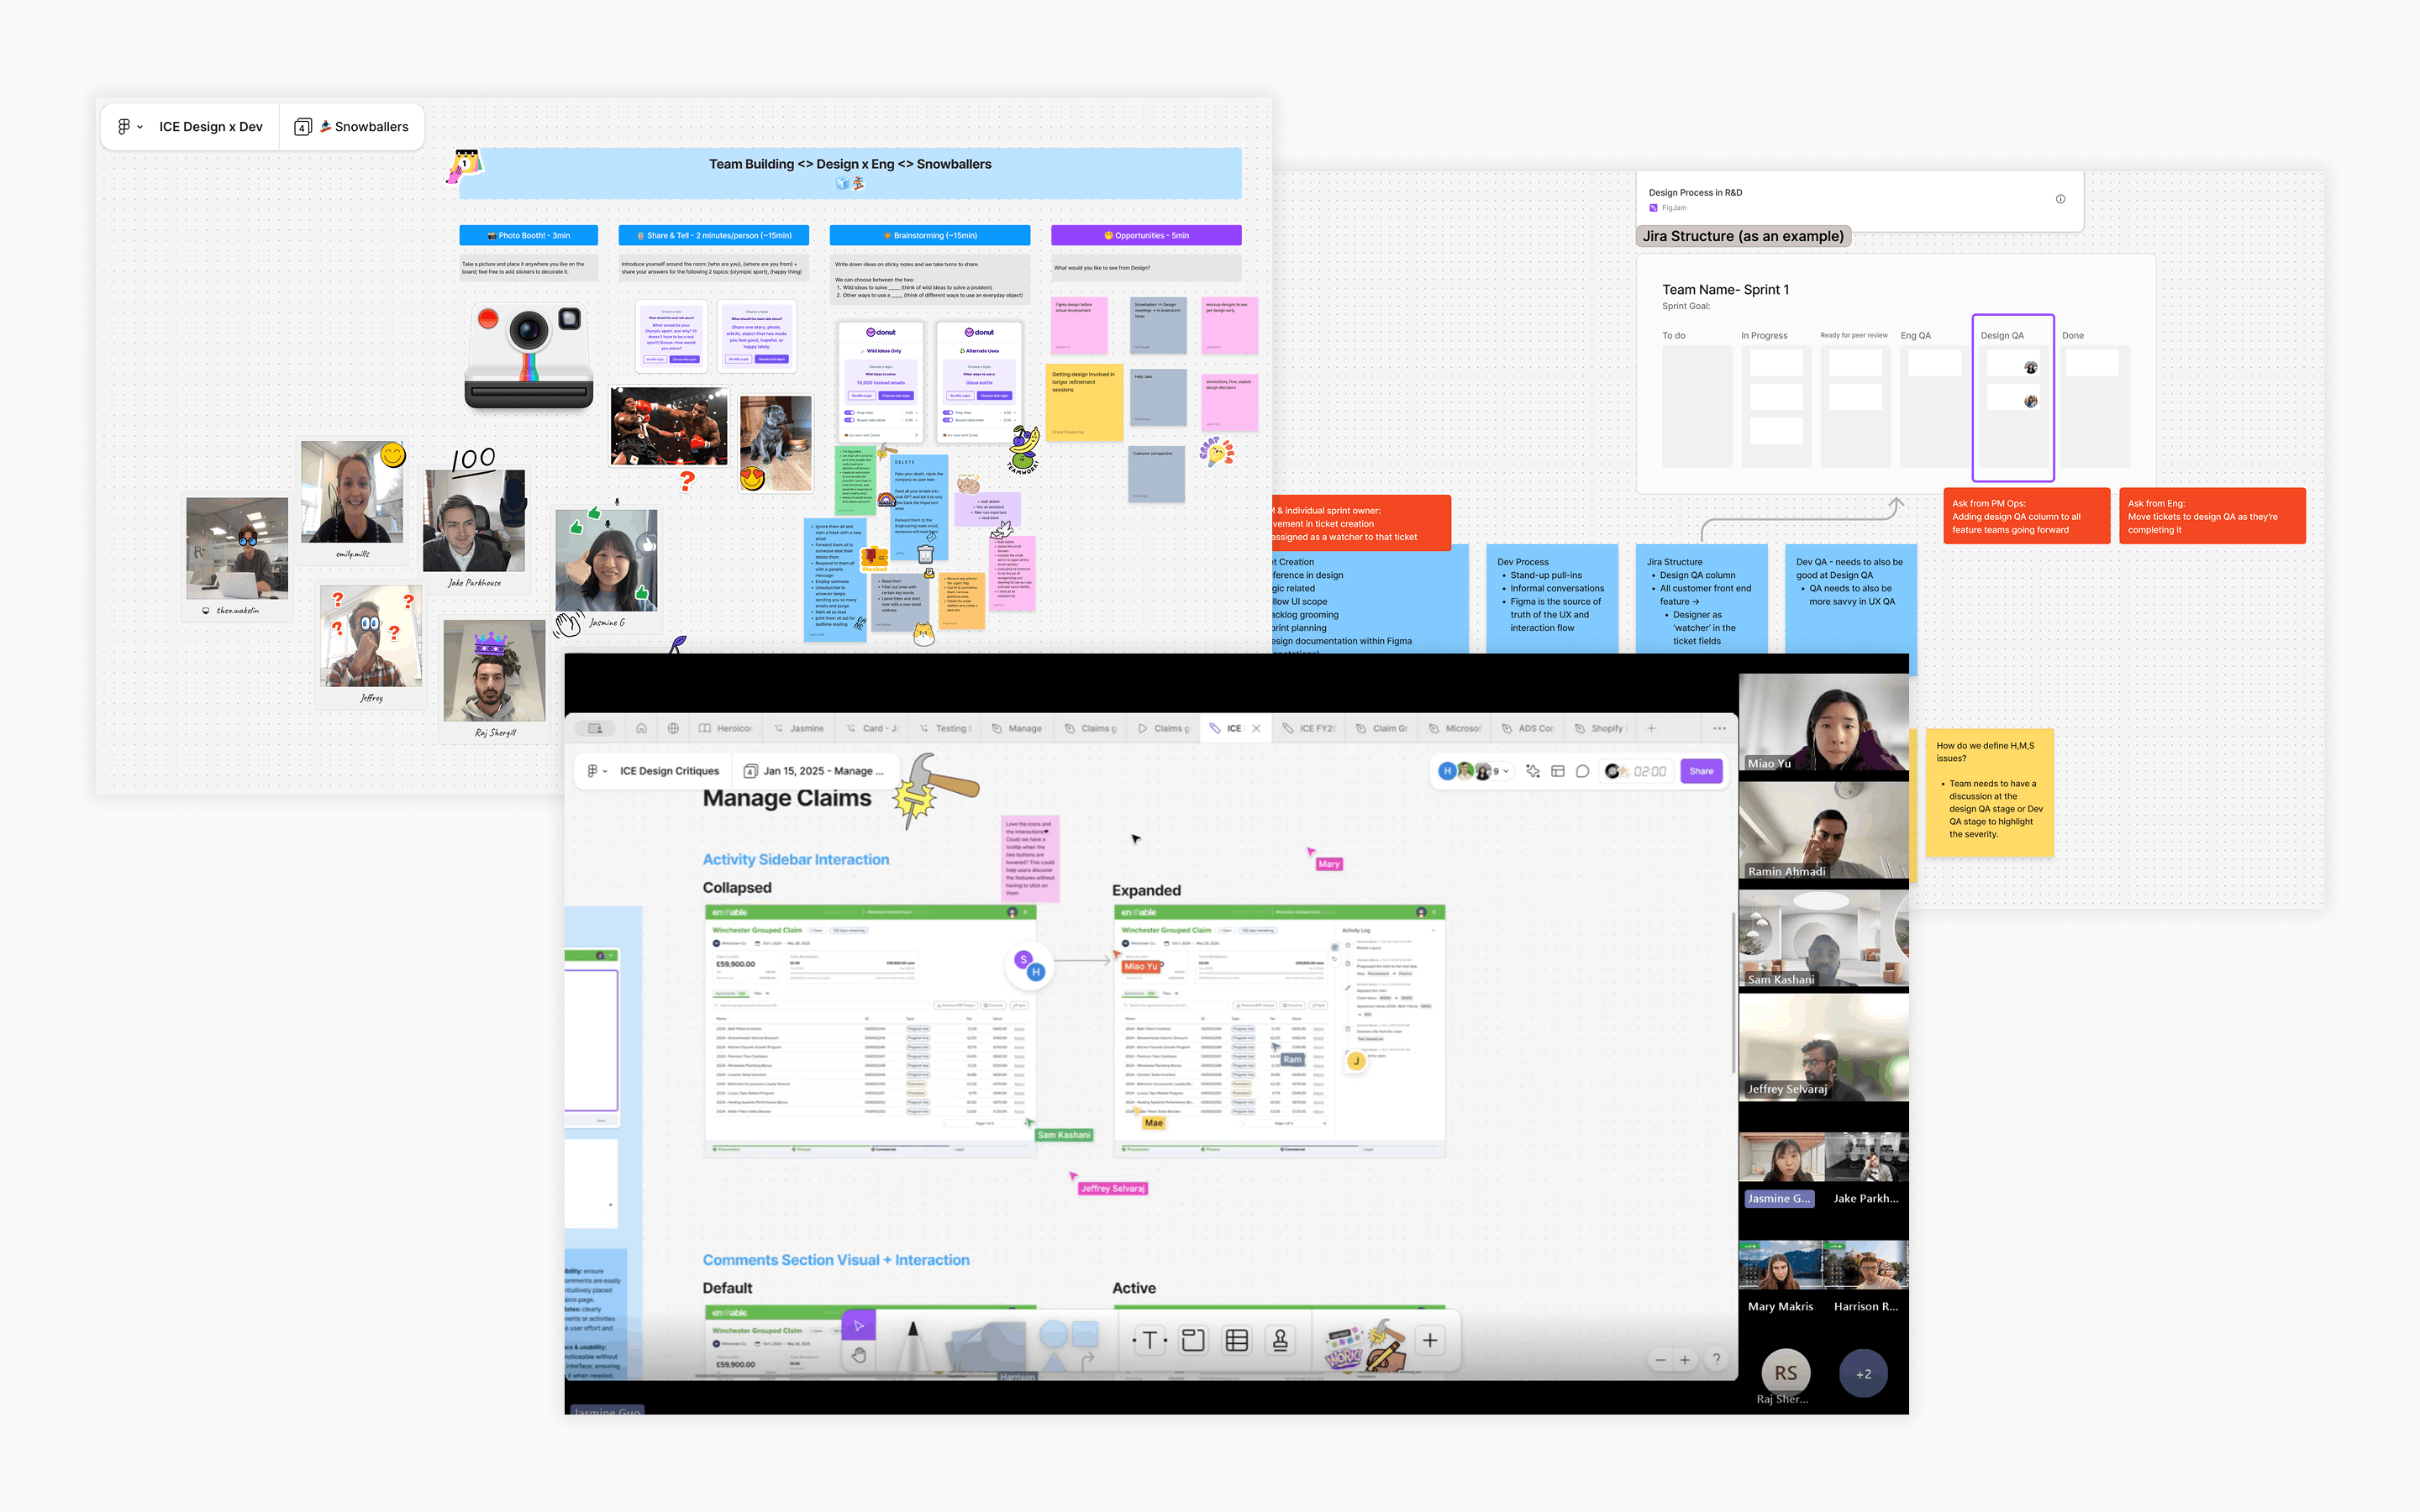
I introduced weekly design critiques using rapid prototypes built with V0, Figma Make, and Lovable — giving the team interactive, clickable concepts to react to rather than static mockups. I collaborated directly with engineers on solutions, not just handing off specs.
The result was a genuine shift. Engineers became true design partners — proactively suggesting features and caring about the user experience. The linked claims feature is a perfect example: it was suggested by an engineer, and we ran a 2-day hackathon to design and prototype it together.
Building design culture: weekly critiques with interactive prototypes, and the 2-day hackathon that produced the linked claims feature
The shift: At the start, engineers saw design as something that slowed them down. By the end, they were the ones suggesting features. I built solid relationships with every engineer on the team — and that trust became the foundation for everything we shipped.
✦ AI AI Layer
Adding an intelligence layer to Claims
After a year of deeply understanding Claims workflows, one pain point stood out above all others: users treat every claim the same, manually reviewing and approving each one — even when 80% follow predictable, routine patterns. The remaining 20% that actually need human judgment get the same amount of attention as the ones that don't.
I designed an AI layer that solves this by answering three questions at every stage of the workflow:
🎯
What's relevant to me?
AI triage on the listing page sorts claims by priority — auto-approving routine ones and surfacing only what needs human attention.
🔍
Why does this need attention?
Anomaly detection explains what's unusual — unexpected amounts, missing data, deviations from historical patterns — directly in the claim detail.
⚡
What should I do?
AI suggests actions (approve, query, hold, split) with reasoning based on previous data, while always letting the user override.
The listing: AI triage
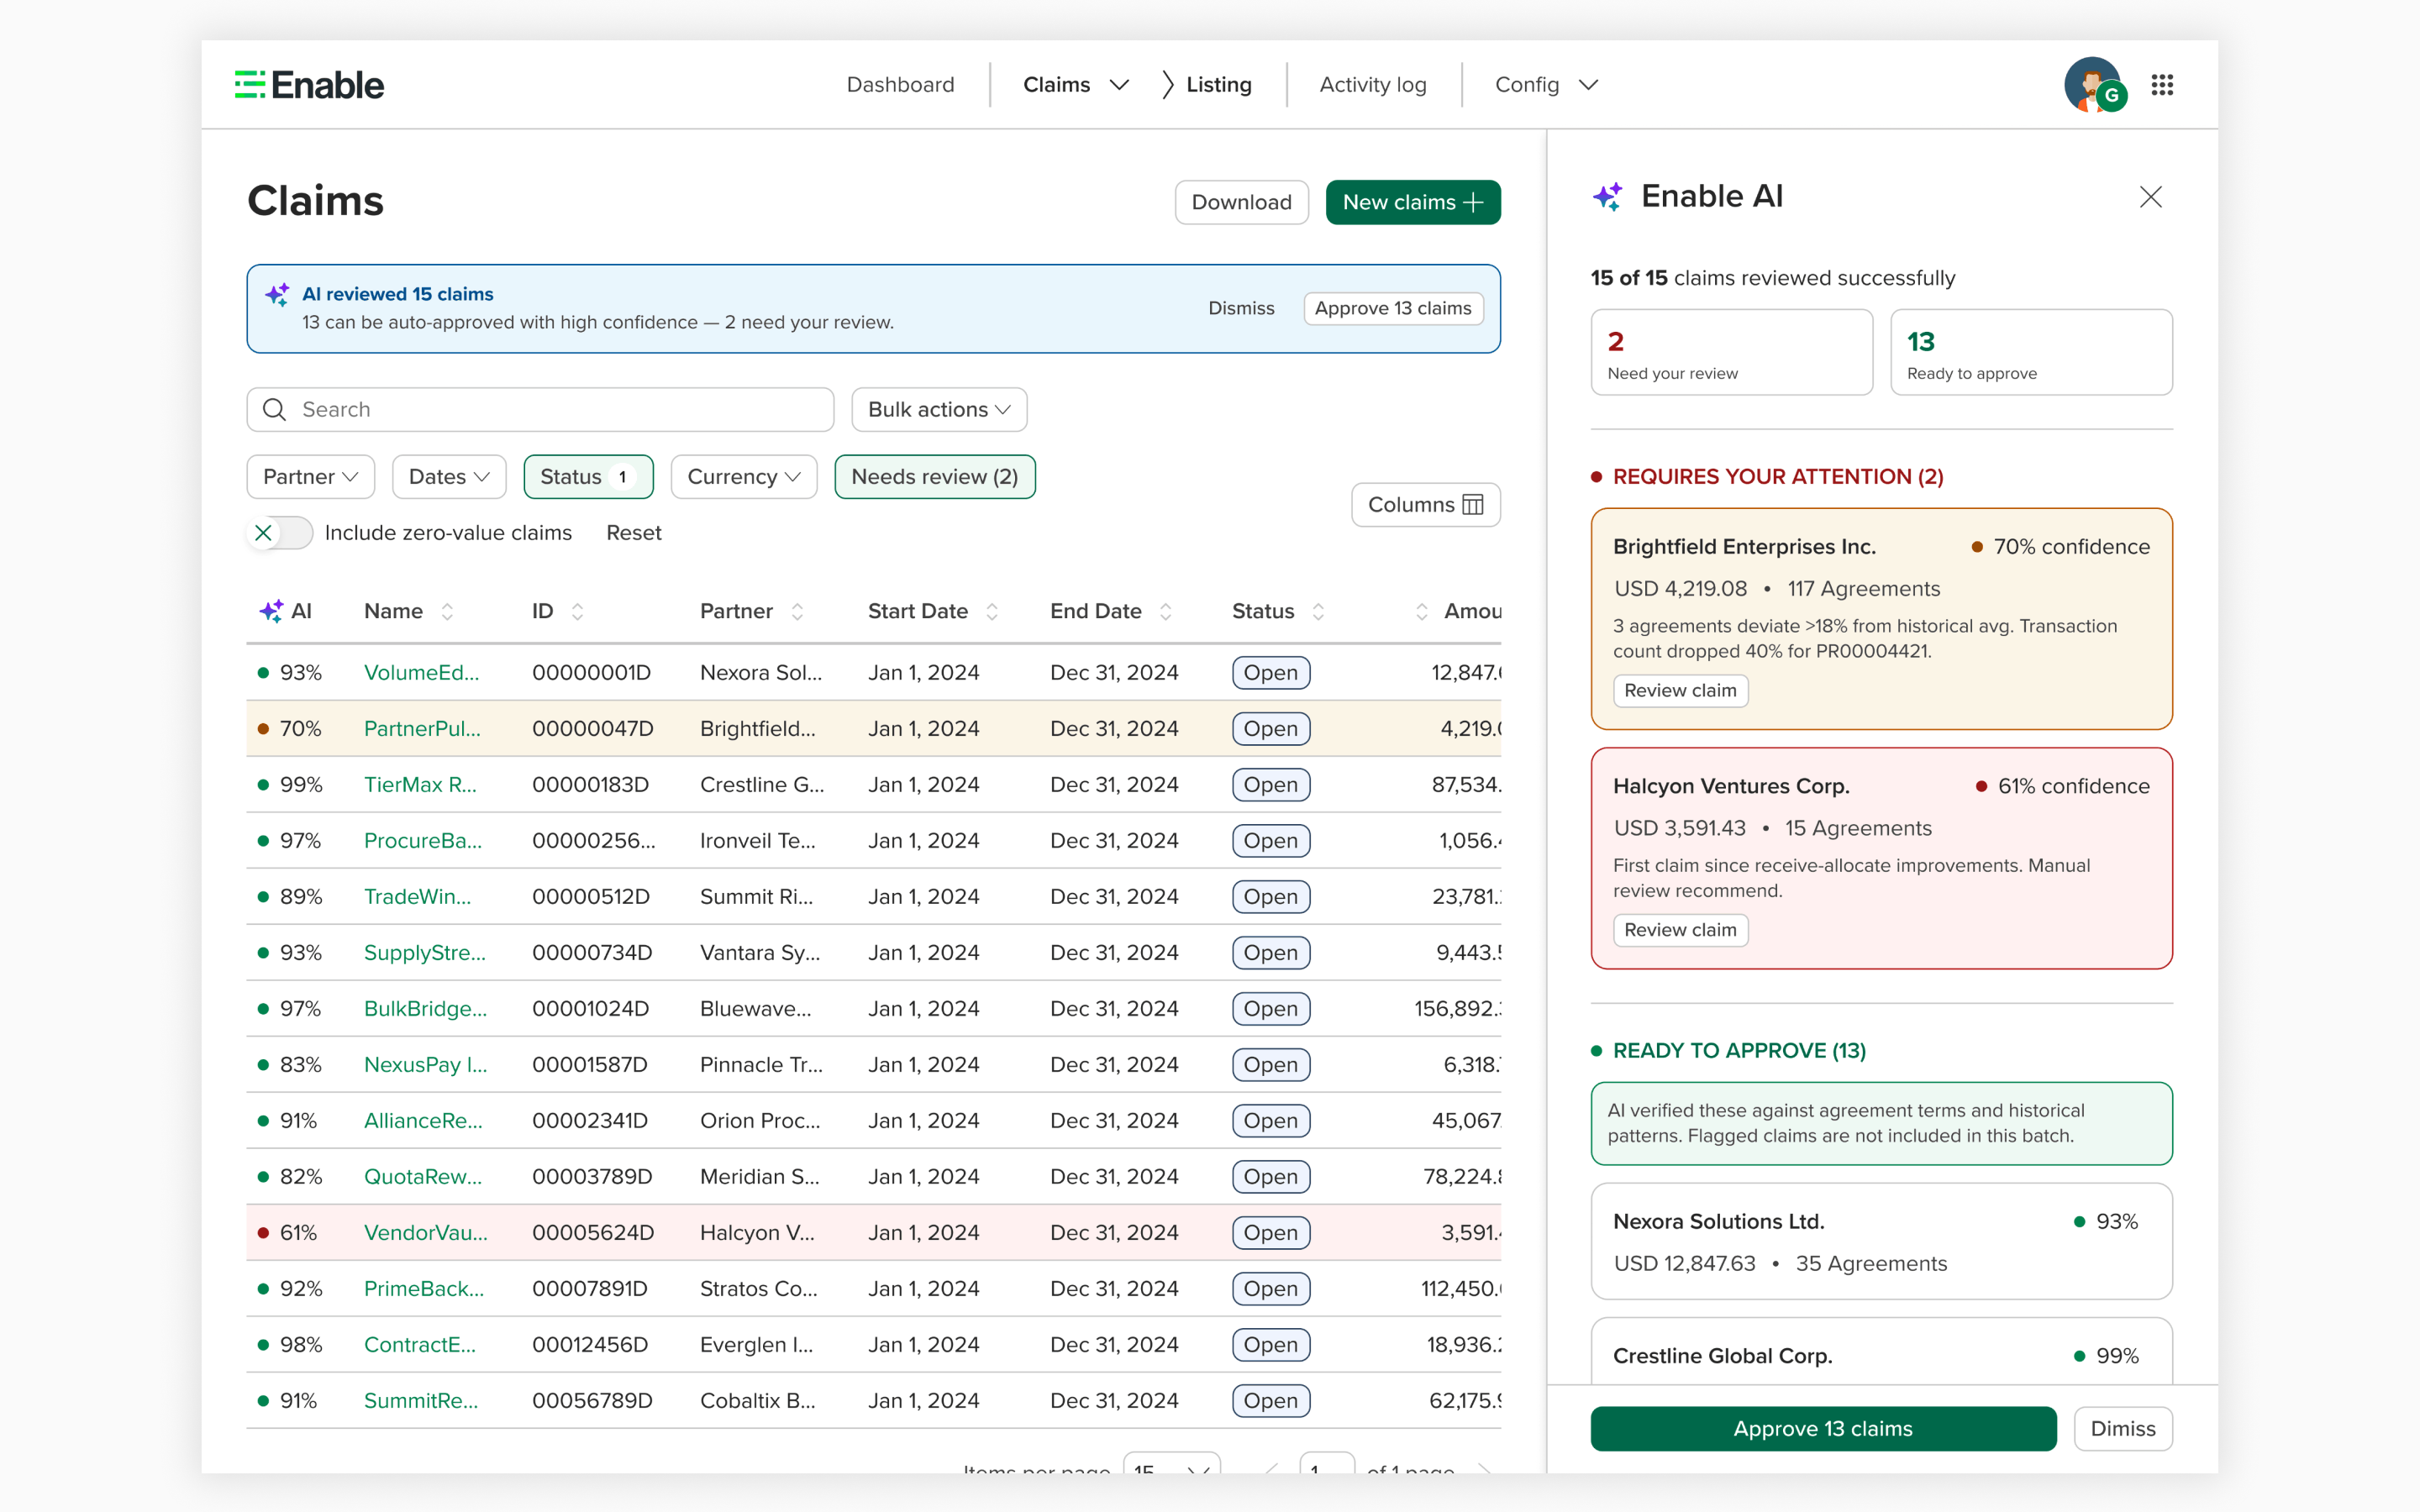
At the listing level, an AI triage bar summarizes the full picture: how many claims were auto-approved, how many need review, and why. Users can filter to jump directly to the claims that need their judgment — instead of scrolling through hundreds of routine items to find the 3 that matter.
Click to expand
AI triage on the claims listing — 5 of 8 claims auto-approved, 3 surfaced for manual review with confidence scores
The detail: anomaly detection & suggested actions
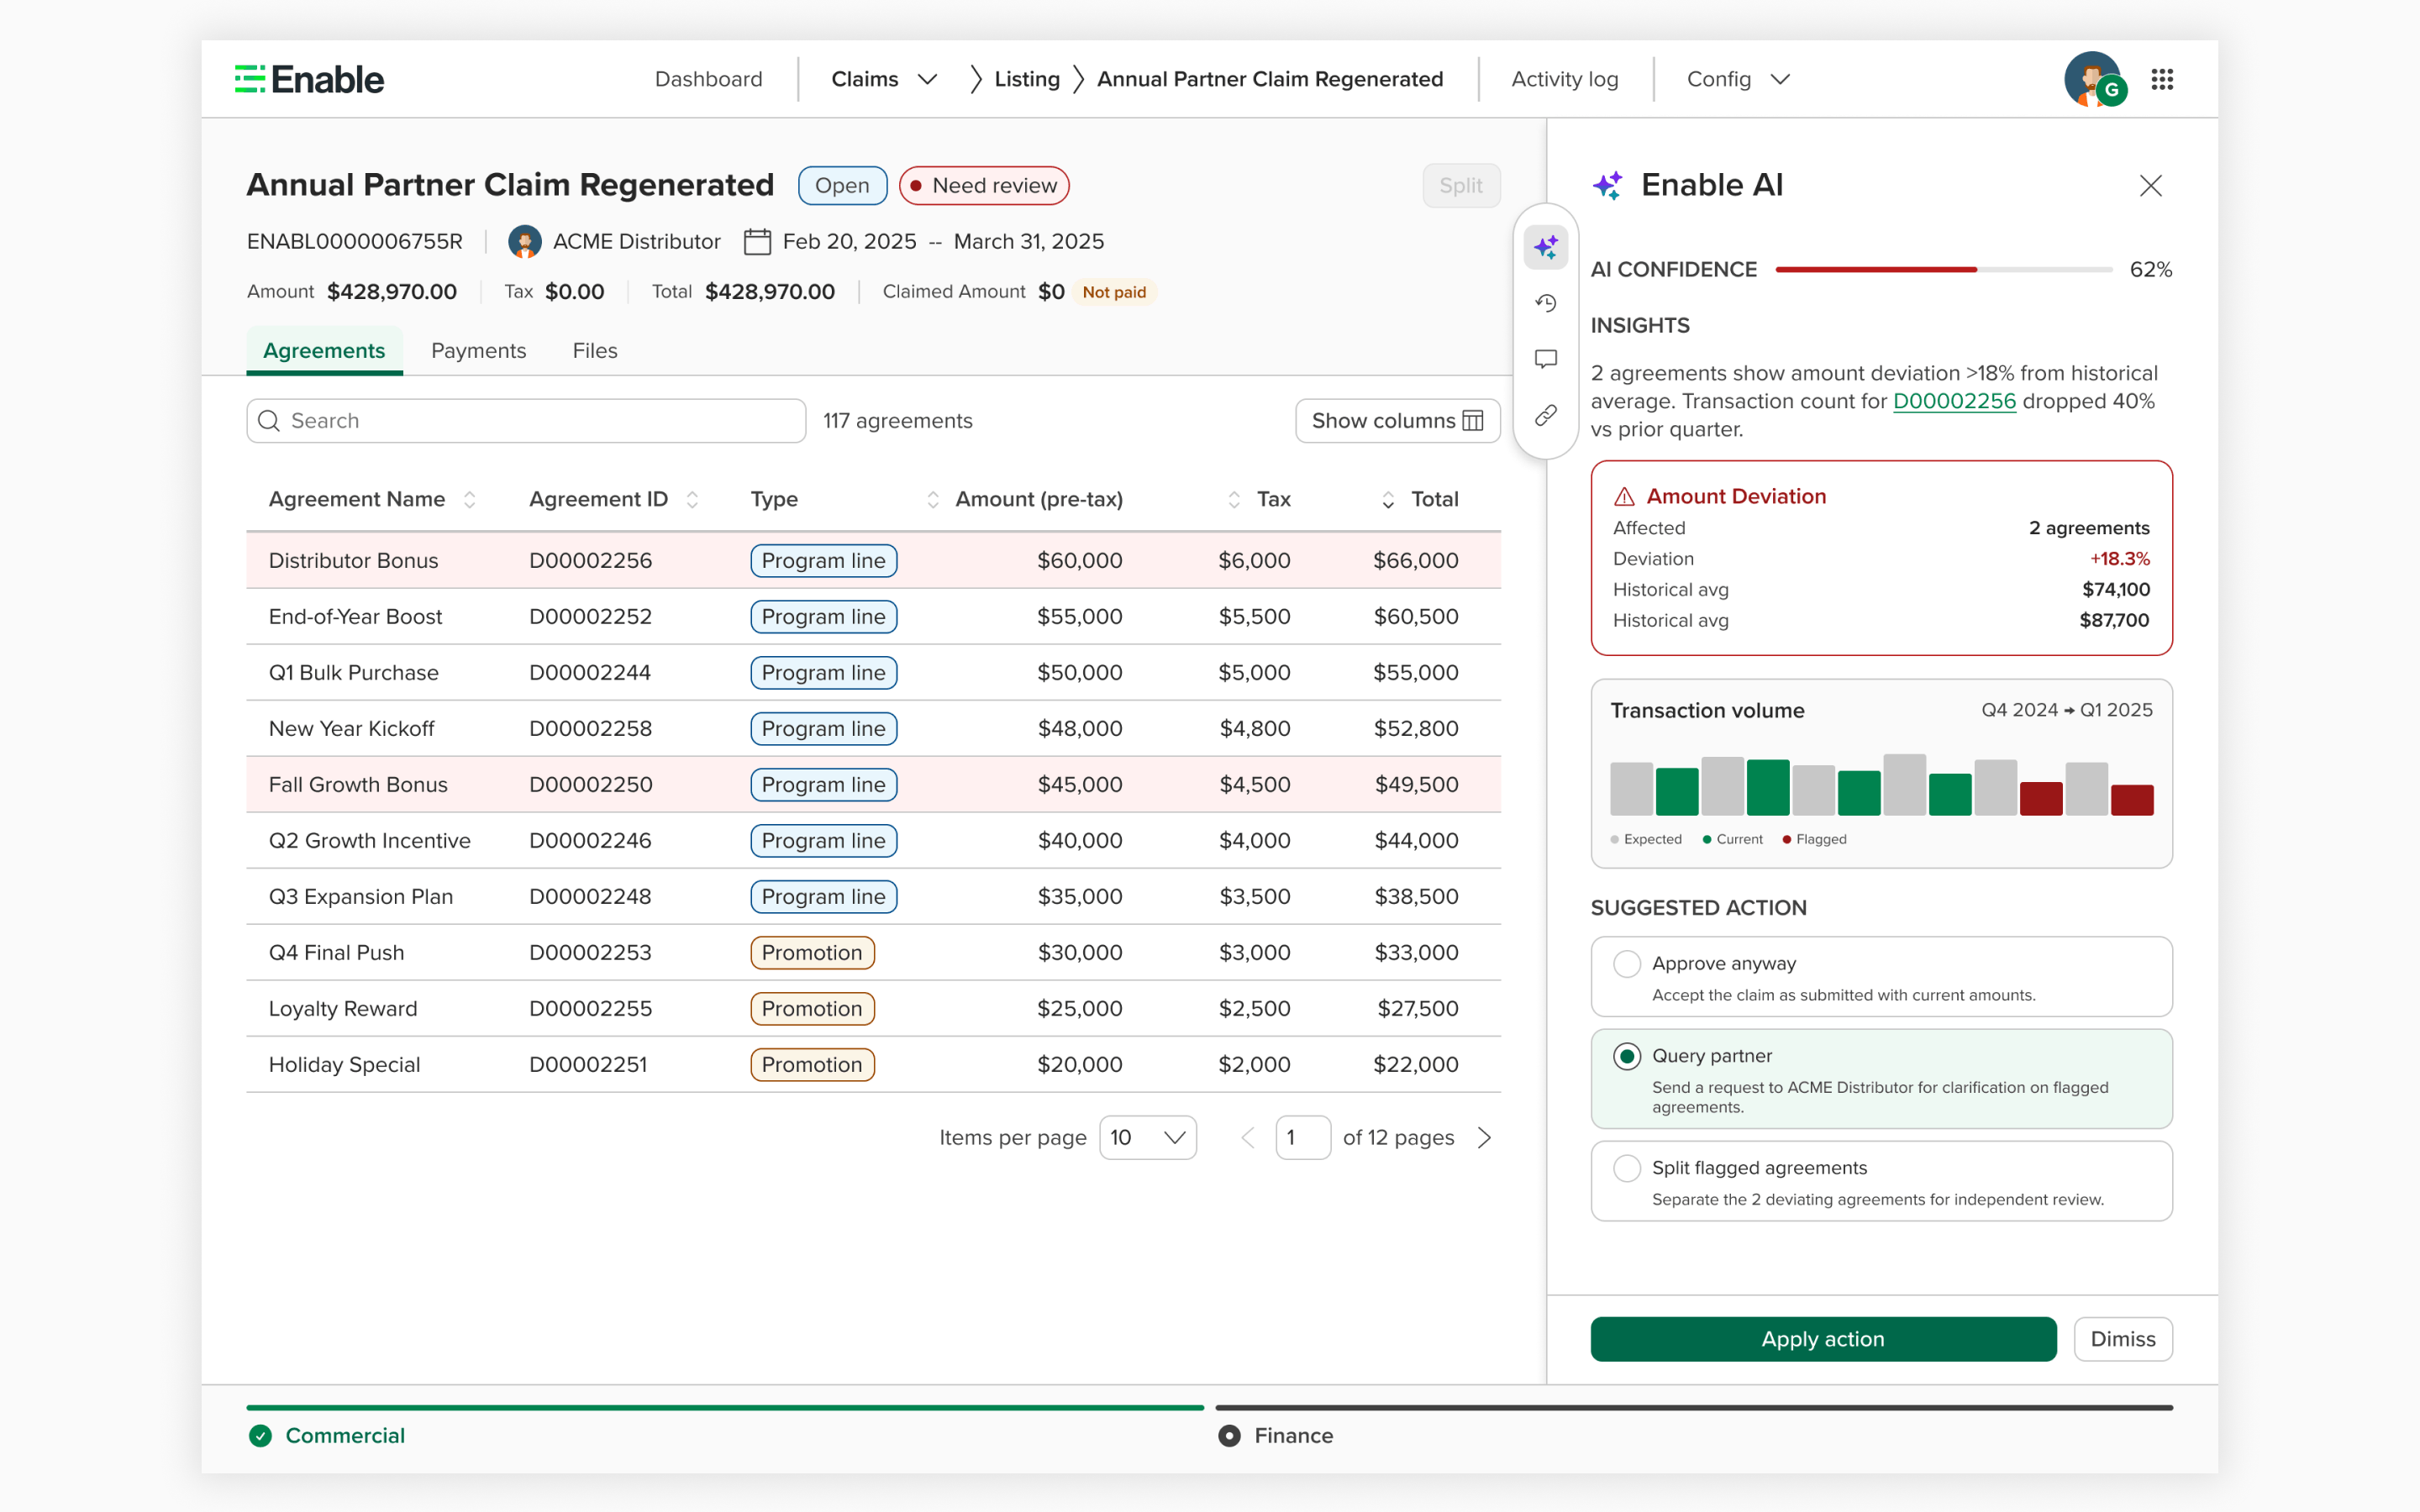
When a user opens a flagged claim, the AI insight panel (right sidebar) explains exactly what triggered the flag — amount deviations, missing transaction data, or first-time partner patterns. Flagged agreements are highlighted directly in the table. Below the analysis, AI suggests the most appropriate action with reasoning, while always offering alternatives. Every decision is logged in an audit trail for compliance.
Click to expand
Claim detail with AI insight panel — anomaly flagged on 3 agreements with 18.3% deviation, AI recommends querying the partner
Design principles
Three principles guided every decision in this AI layer:
Augment, don't replace. The AI panel is a sidebar on the existing detail page — not a new screen. It fits into the workflow users already know.
Explain, don't just decide. Every auto-approval and every flag comes with reasoning. Users can trust the system because they can see why.
Override always available. Users are never locked into the AI's recommendation. Every suggested action includes alternatives, and every auto-approval can be reversed.
Built with: Interactive prototype built using Claude Code with React, grounded in real customer data patterns from Currys, Watsco, City Electrical and other Claims customers. Designed to integrate with the existing claim detail page I redesigned — the AI layer sits on top of the foundation, not beside it.
✦ AI AI-Native Vision
Reimagining Claims for an AI-native world
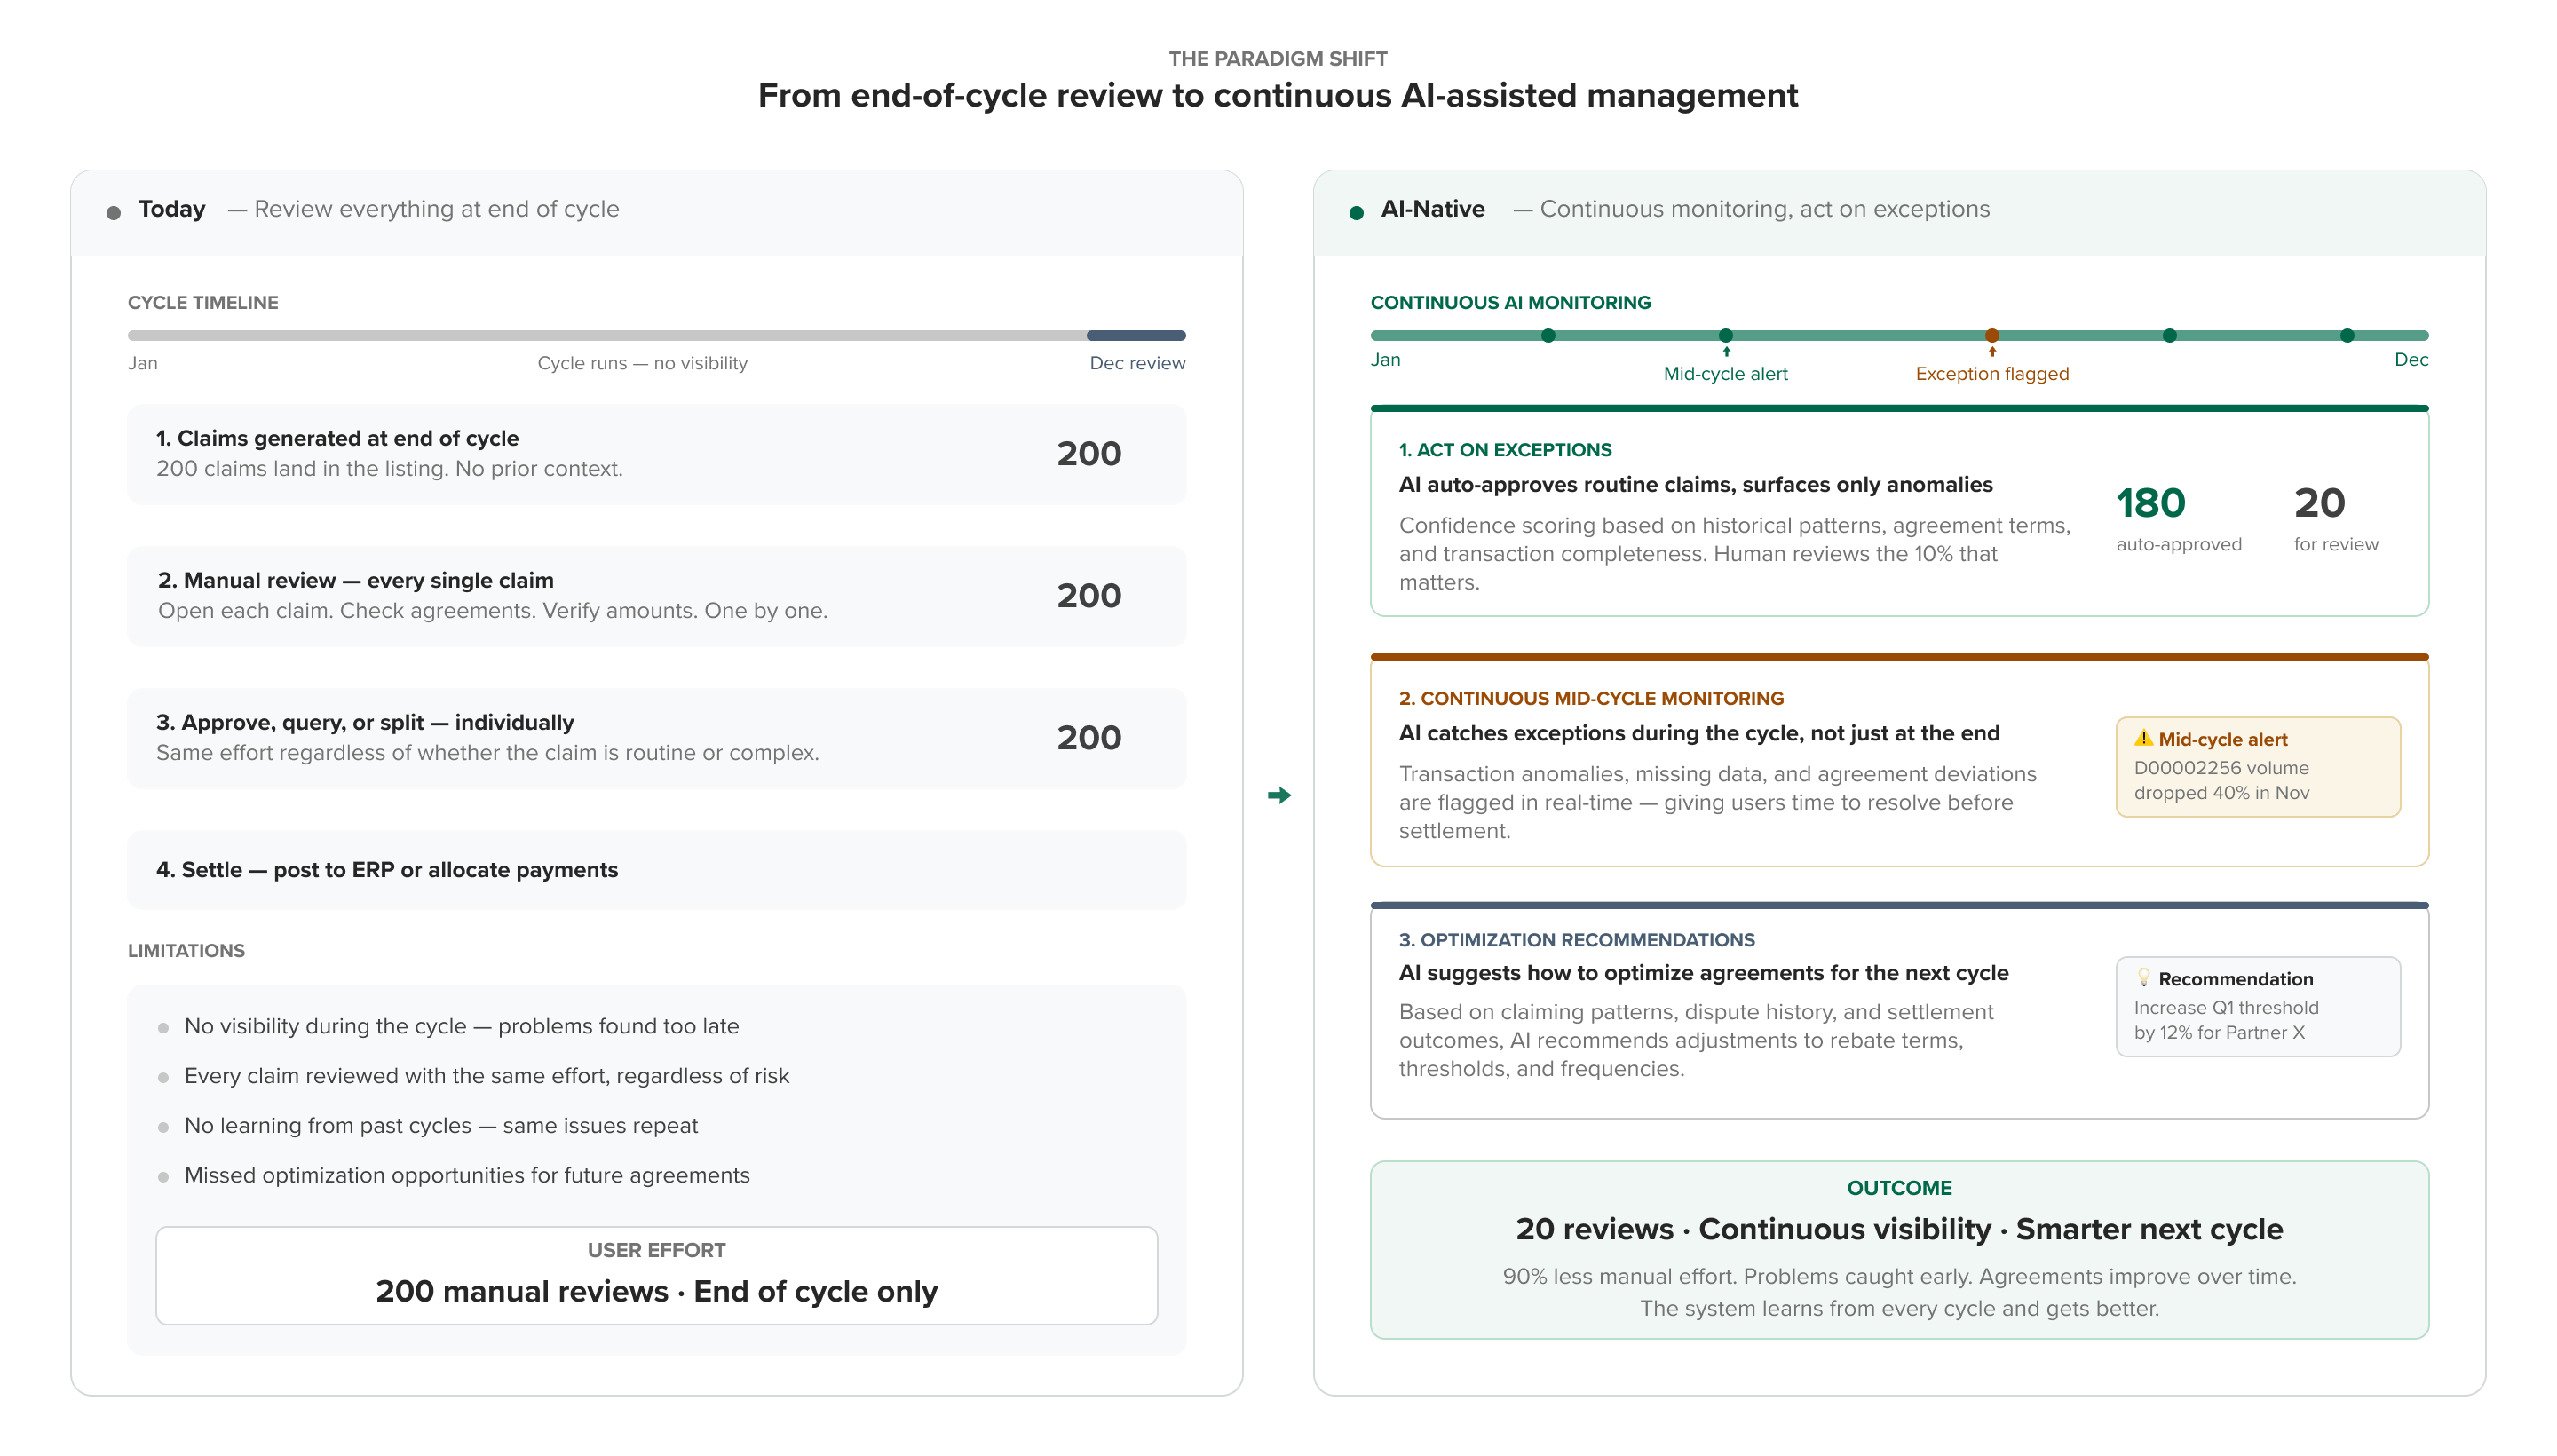
If we were building a rebate claims system today, with AI at the core, the fundamental interaction model would change. Instead of reviewing everything at the end of the cycle, the AI monitors continuously, catches exceptions mid-cycle, acts on anomalies based on historical data, and even recommends optimizations for future agreement terms.
Click to expand
The paradigm shift: from end-of-cycle manual review to continuous AI monitoring with exception-based action and optimization recommendations
V·1
Rebate Operations Command Center
Claims Dashboard
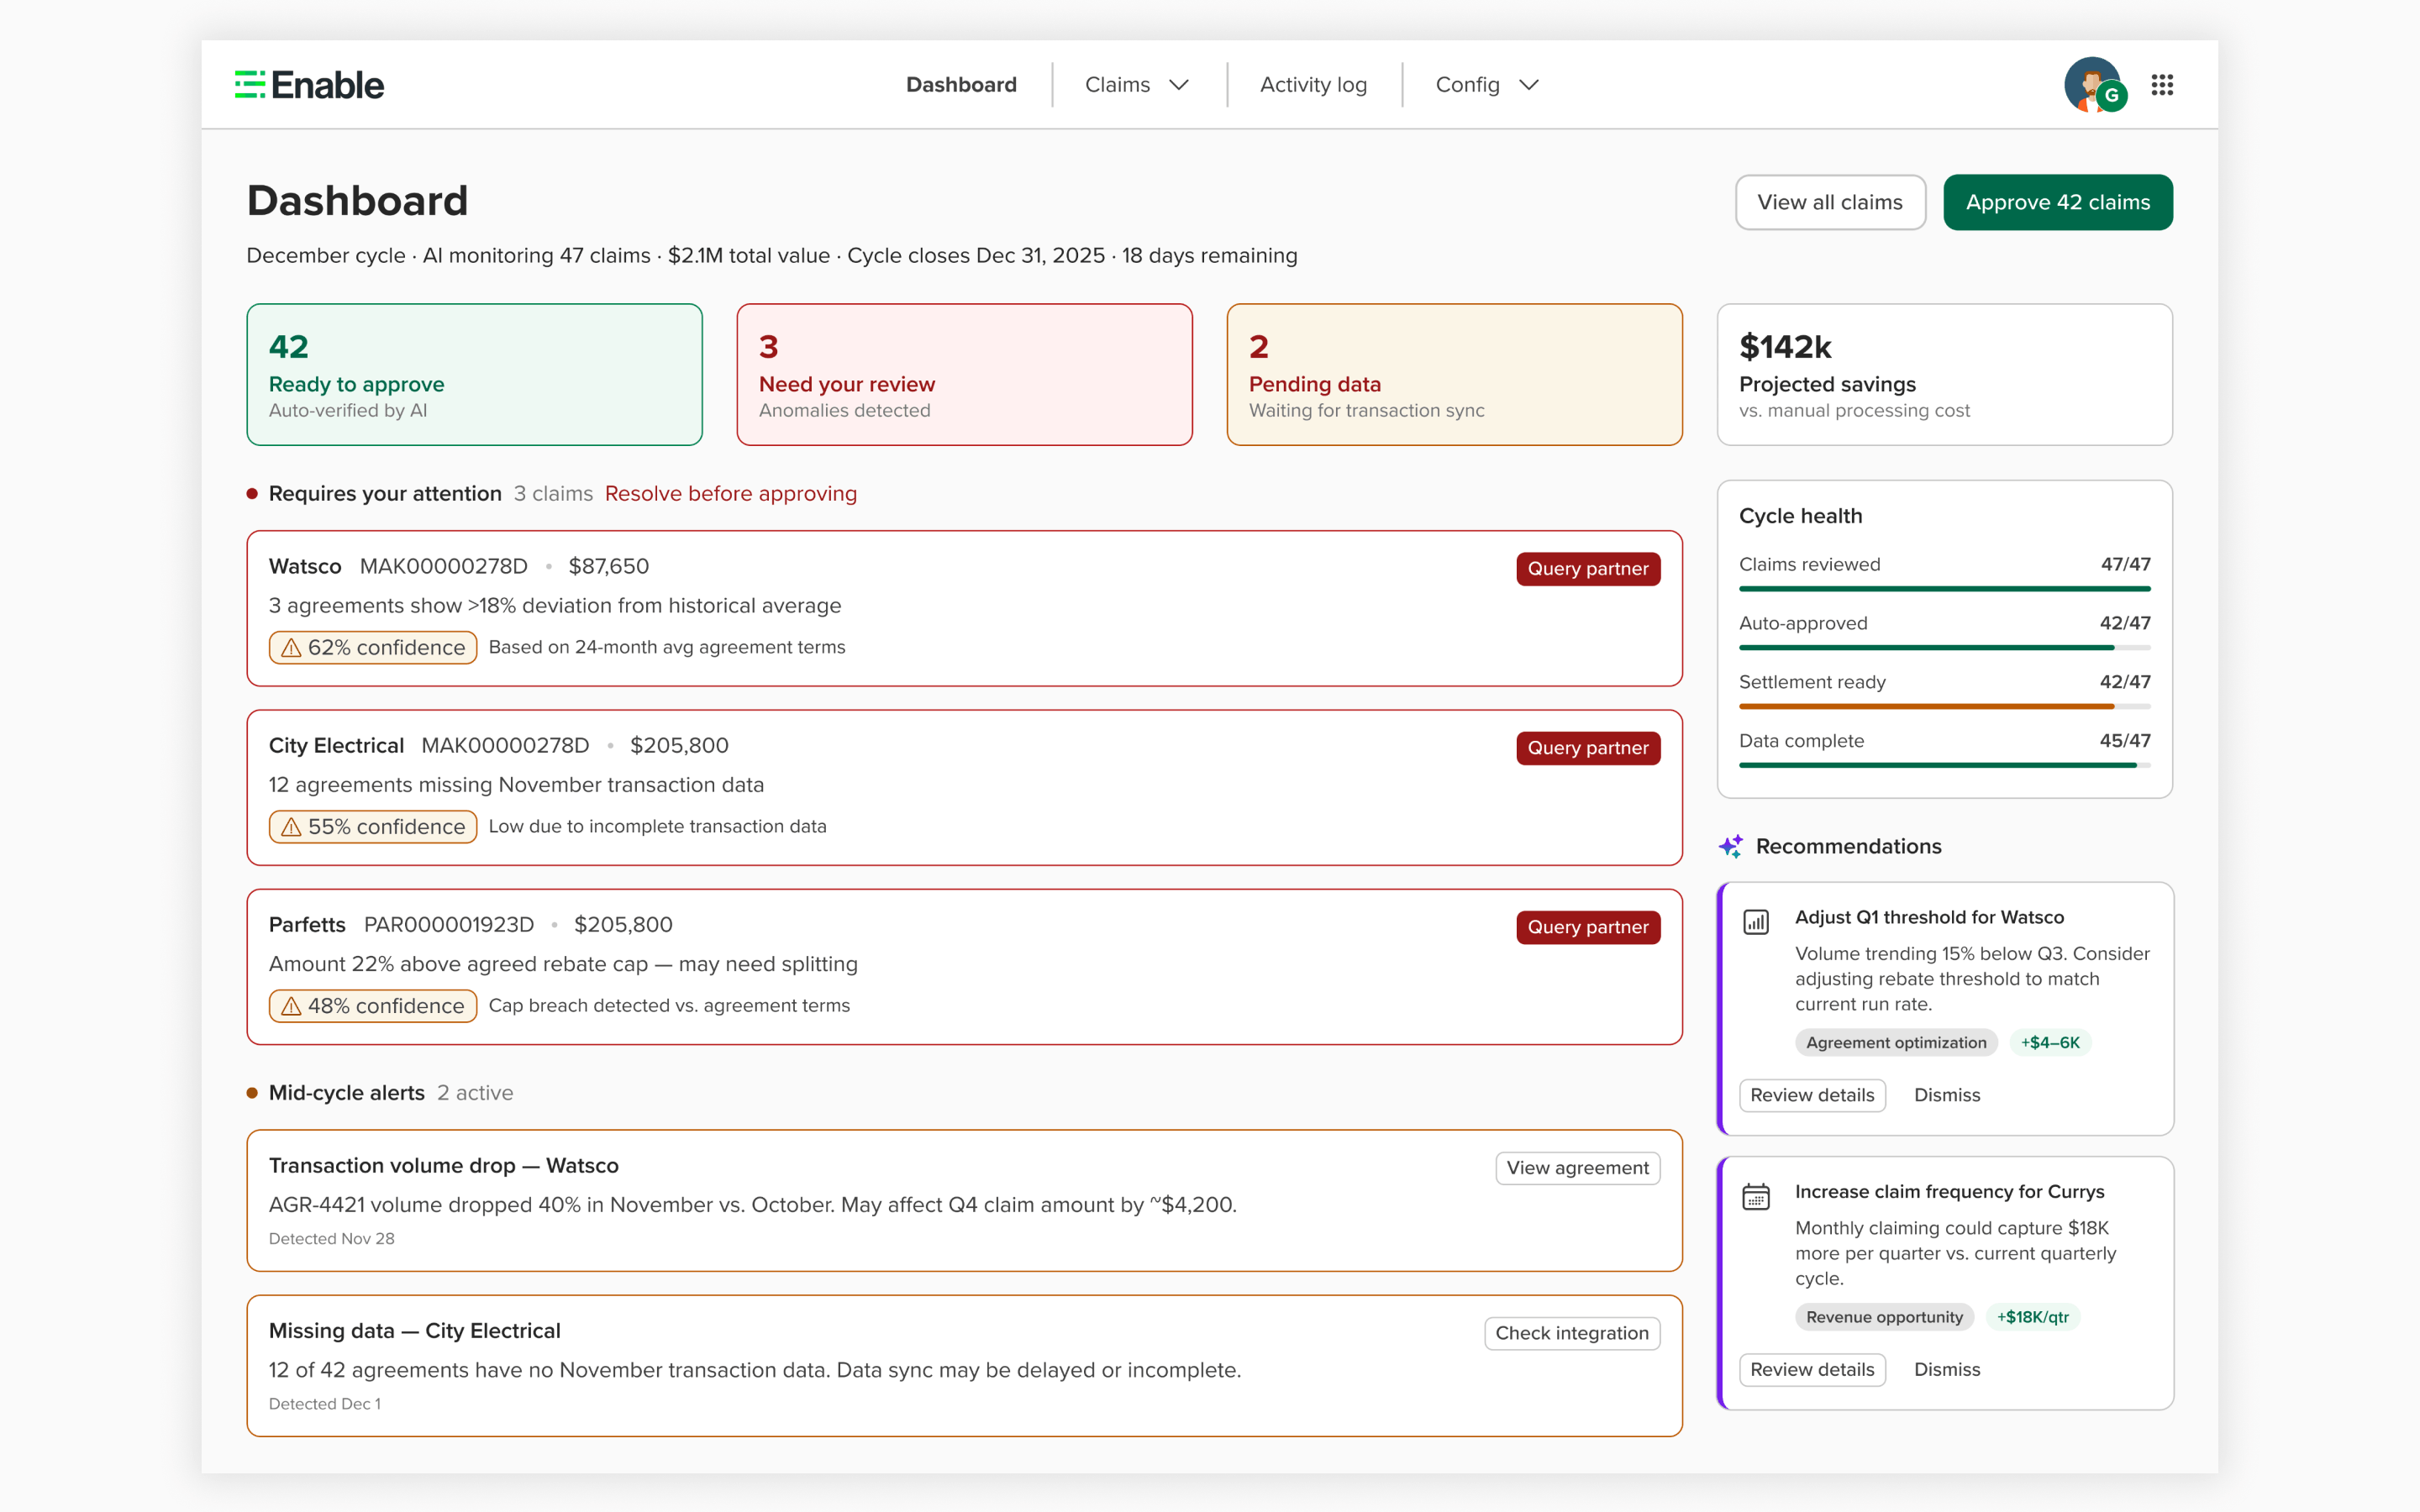
The existing claims listing becomes a dashboard that surfaces what matters. Instead of scrolling through hundreds of claims, users see: cycle health metrics, mid-cycle alerts the AI caught during the period, claims requiring their attention with confidence scores and explanations, and AI-generated recommendations for optimizing future agreement terms. The 90% of claims that pass all checks are auto-verified and ready to approve in one click.
Click to expand
Claims Dashboard — cycle health, mid-cycle alerts, exception cards with AI reasoning, and optimization recommendations for future agreements
V·2
Contextual AI & Conversational Actions
AI-Assisted Claim Detail
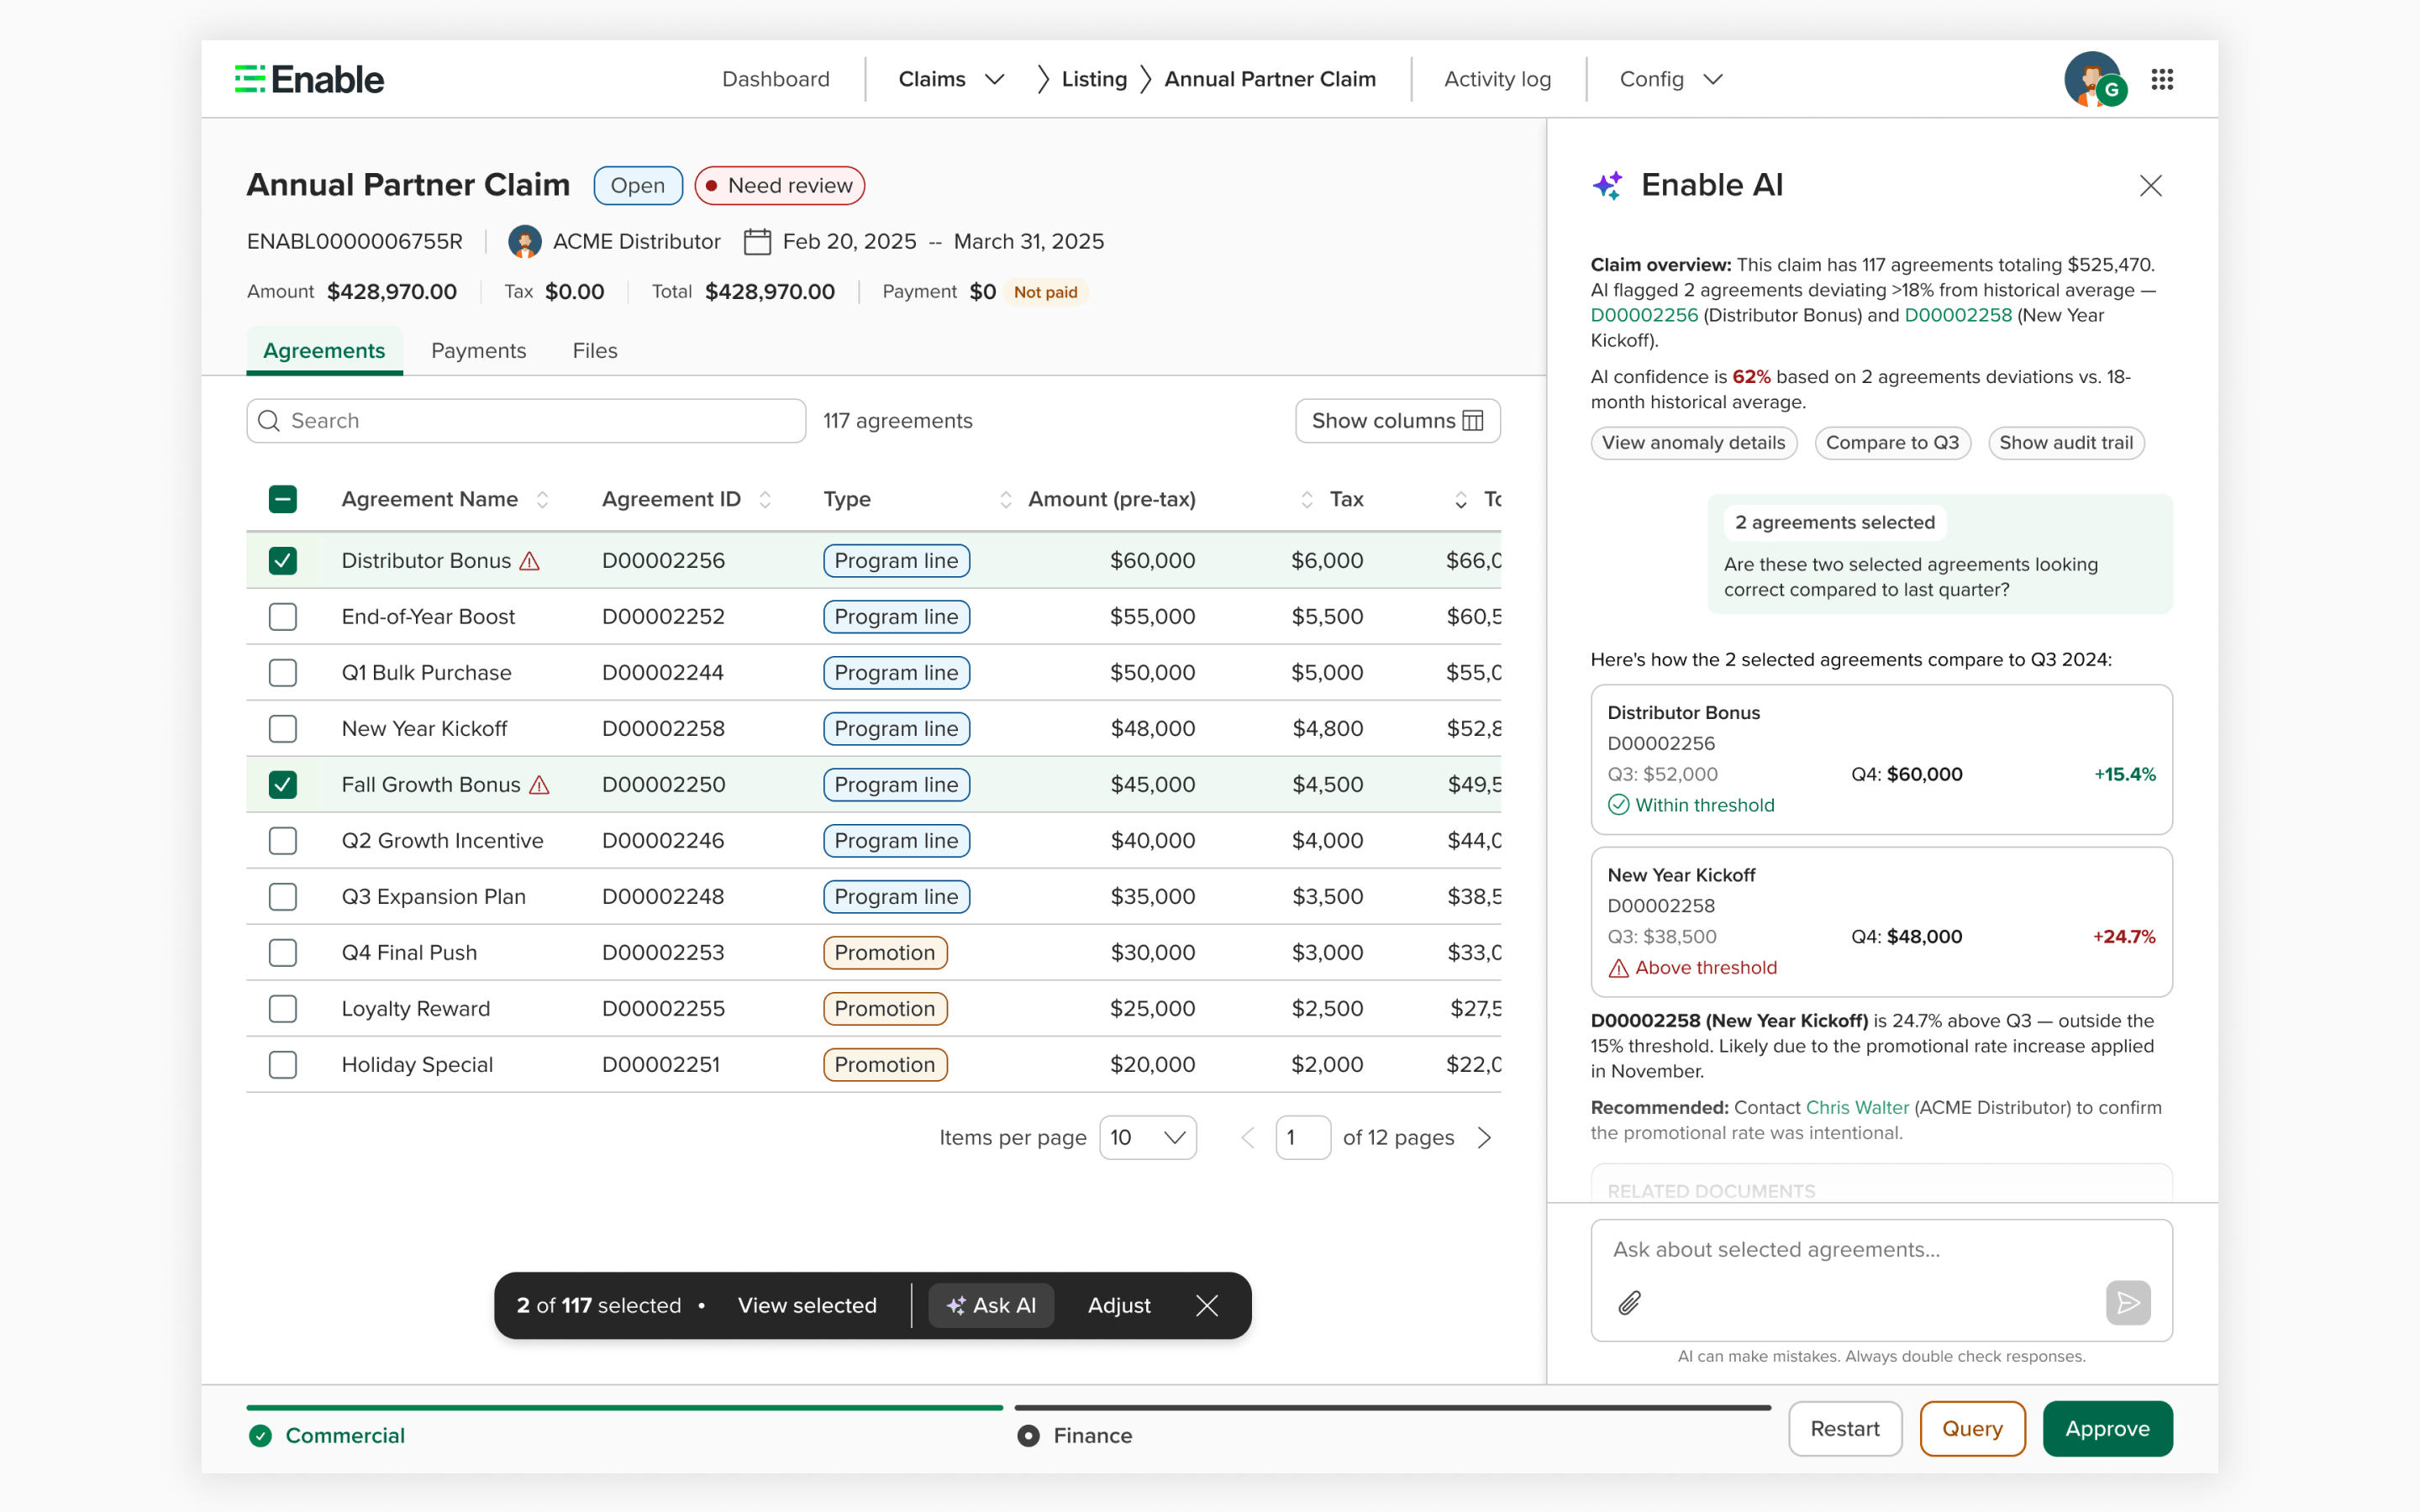
When users drill into a claim, they can select specific agreements and ask the AI contextual questions: "Are these numbers correct compared to last quarter?" The AI responds with historical comparisons, threshold analysis, and specific recommendations — including who to contact and why. It surfaces the full audit trail: summary PDFs, transaction files, and email receipts. Users can also give natural language commands to split, query, or adjust claims directly from the conversation.
Click to expand
AI-assisted claim detail — user selects 2 agreements, asks the AI to compare against Q3, receives threshold analysis with contact recommendation and related documents
Impact
From "nobody wants this" to $3M+ ARR
When I joined, customers were refusing to adopt Claims. By the end of the year, Claims was a revenue-generating product surface with active enterprise adoption and a growing onboarding pipeline.
💰
$3M+
Annual recurring revenue from current Claims customers
📈
$2M+
Incremental revenue unlocked through enterprise adoption
🚀
10+
Major features shipped in 9 months post-foundation redesign
Beyond revenue, the impact extended across the team and organization:
Customer adoption: Went from zero enterprise adoption to serving SMB, mid-market, enterprise, and strategic customers (1 to 10+ users each)
Design system: First team to adopt Enable's design system in production, creating a reference implementation
Engineering culture: 15–20 engineers went from never having worked with a designer to actively contributing design ideas
Reflection
What I learned
1
Foundation before features
Spending three months on the claim detail page redesign felt slow at the time. But that foundation made the next 9 months of rapid feature delivery possible. Every feature we shipped — splitting, bulk actions, payments, templates — was only buildable because the foundation was right. The lesson: invest in the infrastructure even when there's pressure to ship.
2
Design culture is built through trust, not process
Weekly design critiques and interactive prototypes helped, but what actually shifted the culture was consistent, respectful collaboration with every engineer on the team. Trust isn't built by imposing process — it's built by showing up, listening, and caring about the same things they care about. The linked claims "hackathon" happened because they trusted me enough to co-create.
3
B2B complexity requires domain depth
Claims isn't a product you can redesign from the outside. The month I spent on onboarding and the UX audit paid dividends all year — every design decision was grounded in understanding how rebate operations actually work. Shortcuts in discovery would have led to designs that looked good but didn't serve the workflow.
4
AI is a layer, not a replacement
Working through the AI concepts reinforced something important: the best AI applications in B2B don't replace the workflow — they make the human faster and more confident within it. The Attention Dashboard works because it still gives users control. The split suggestions work because users can reject them. Trust in AI is earned through transparency and human agency.