1 / 23
↓ Space · Arrow keys to navigate
Case Study Presentation Kehui (Jasmine) Guo
Web · B2B SaaS · Nov 2024 – Dec 2025

Enable Claims

Transforming claims & settlements for scalable rebate operations. A 0-to-1 redesign over 13 months.

Role
Lead Product Designer (Solo)
Team
15–20 Engineers · 3 PMs · 1 PMM
Scope
UX audit · Redesign · 10+ features
Outcome
$3M+ ARR · $2M+ incremental rev
A concrete example

Samsung makes it. BestBuy sells it.

Samsung
Manufacturer
products
Best Buy
Retailer
sells to
👥
CUSTOMERS
End buyers

Samsung makes the products. BestBuy sells them. To keep BestBuy motivated to push Samsung's products hard, Samsung offers rebate incentives: money paid back based on sales performance.

The Agreement

An agreement is a deal.

Samsung and BestBuy sign multiple agreements.

Laptop
Laptops
"Sell a laptop, Samsung pays BestBuy back…"
$50 per unit sold
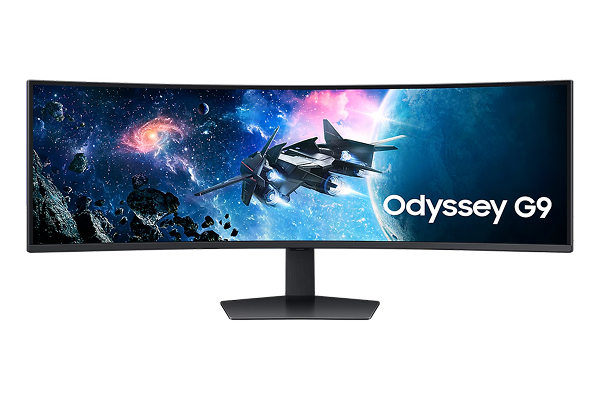
Monitor
Monitors
"Sell a monitor, Samsung pays BestBuy back…"
$25 per unit sold
Phone
Phones
"Sell a phone, Samsung pays BestBuy back…"
$30 per unit sold

Each is a separate contract, all tied to the same trading relationship.

Q1 · Jan – Mar

BestBuy has a great quarter.

Over the first quarter, they sell across all three Samsung product lines.

Laptop
400
Laptops sold
Monitor
600
Monitors sold
Phone
1,000
Phones sold

Now BestBuy needs to formally request the rebate money owed from Samsung. That's where a claim comes in.

The Claim · The key concept

BestBuy bundles all agreements into one claim.

Rather than three separate invoices, BestBuy packages everything into a single claim — one document covering all agreement line items for the quarter.

The relationship that matters: One claim can contain many agreements.
This is the core data model of Enable Claims.
Claim
BestBuy → Samsung · Q1 2025
Open
Laptop
Laptops Agreement
400 units × $50
$20,000
Monitor
Monitors Agreement
600 units × $25
$15,000
Phone
Phones Agreement
1,000 units × $30
$30,000
Total claim value
$65,000
Settlement

Samsung reviews, approves, and pays.

📋
Claim submitted
by BestBuy
🔍
Samsung reviews
validates data
Approved
& settled
$65,000
paid to BestBuy
by Samsung

This is the workflow Enable Claims manages, at scale, across hundreds of trading partners, thousands of agreements, and millions in rebate value. That's what we redesigned.

01 · Context

What is Claims?

Enable is a rebate management platform for complex trading partner agreements. Claims is where those agreements get settled: where money actually moves.

Each cycle: claims are auto-generated → users review and approve → claims post to ERP or settle via payment within Enable.

Customers
Customer logos — Currys, Parfetts, City Electrical, Watsco, BKBG, Solotech
Two Distinct User Workflows
🏢

ERP-Posting Users

Output data to ERP. Currys (20–300 agreements/claim), Parfetts, City Electrical.

💳

Payment Users

Receive and allocate payments entirely within Enable. Watsco, BKBG, Solotech.

Same product. Different mental models. Different failure modes.
Where We Started
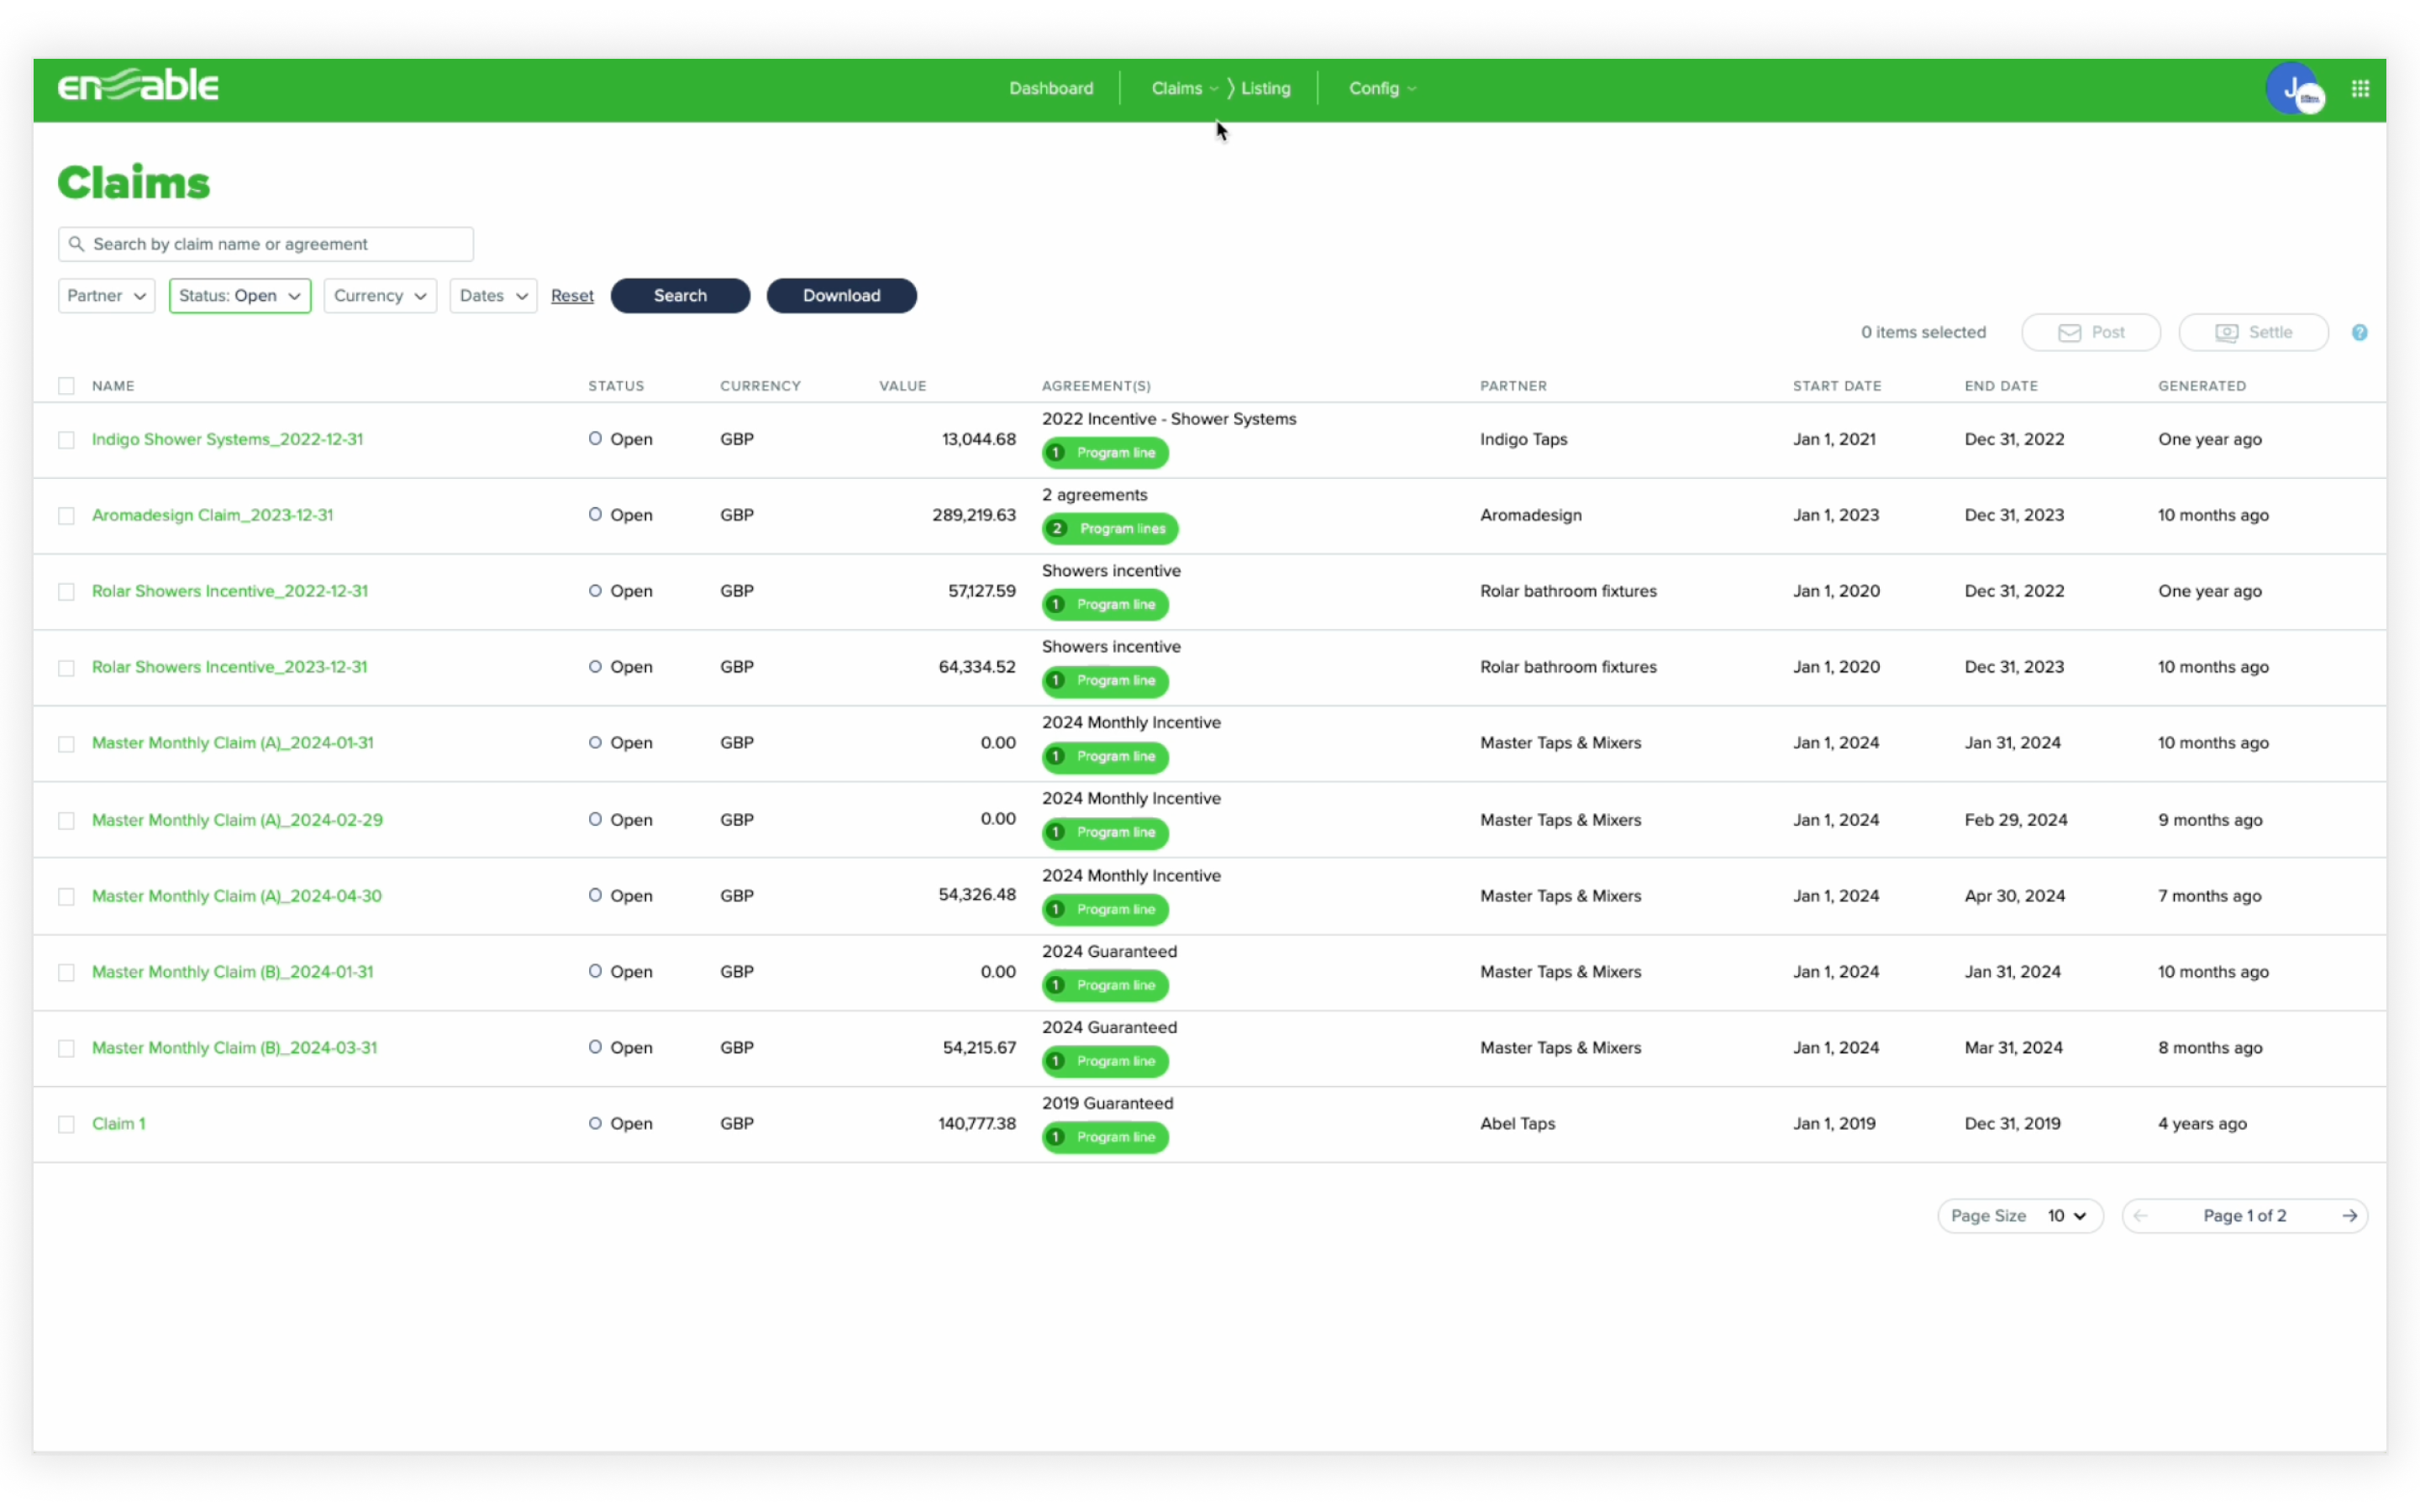
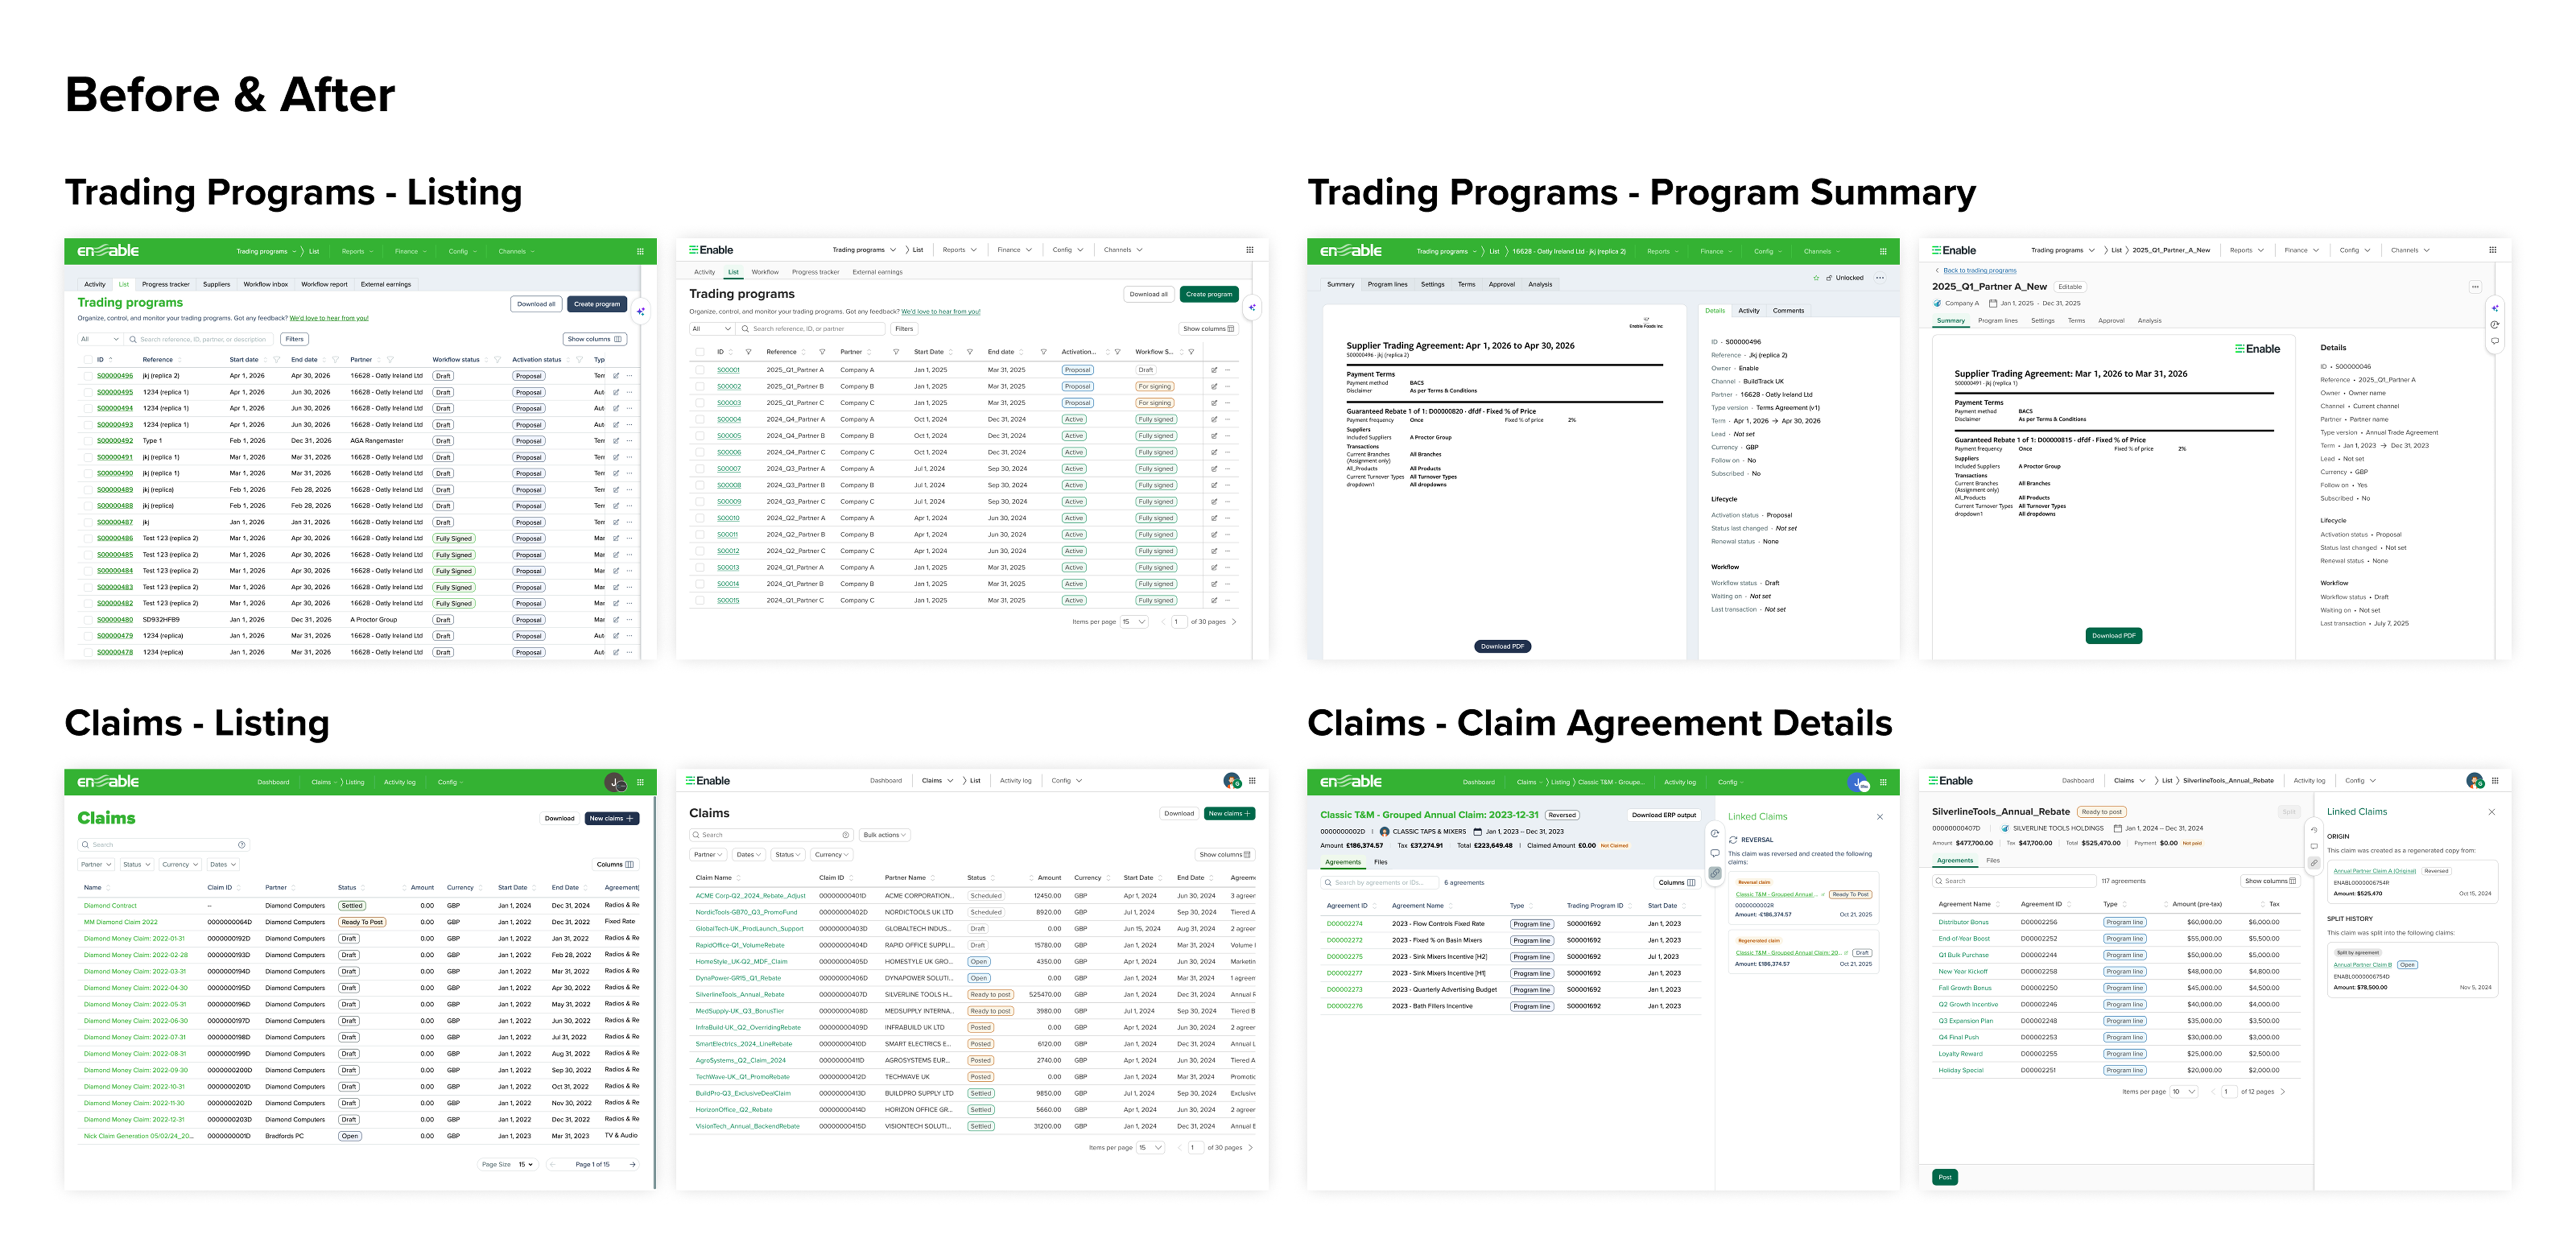
Claims Listing · Nov 2024
Claims listing before redesign
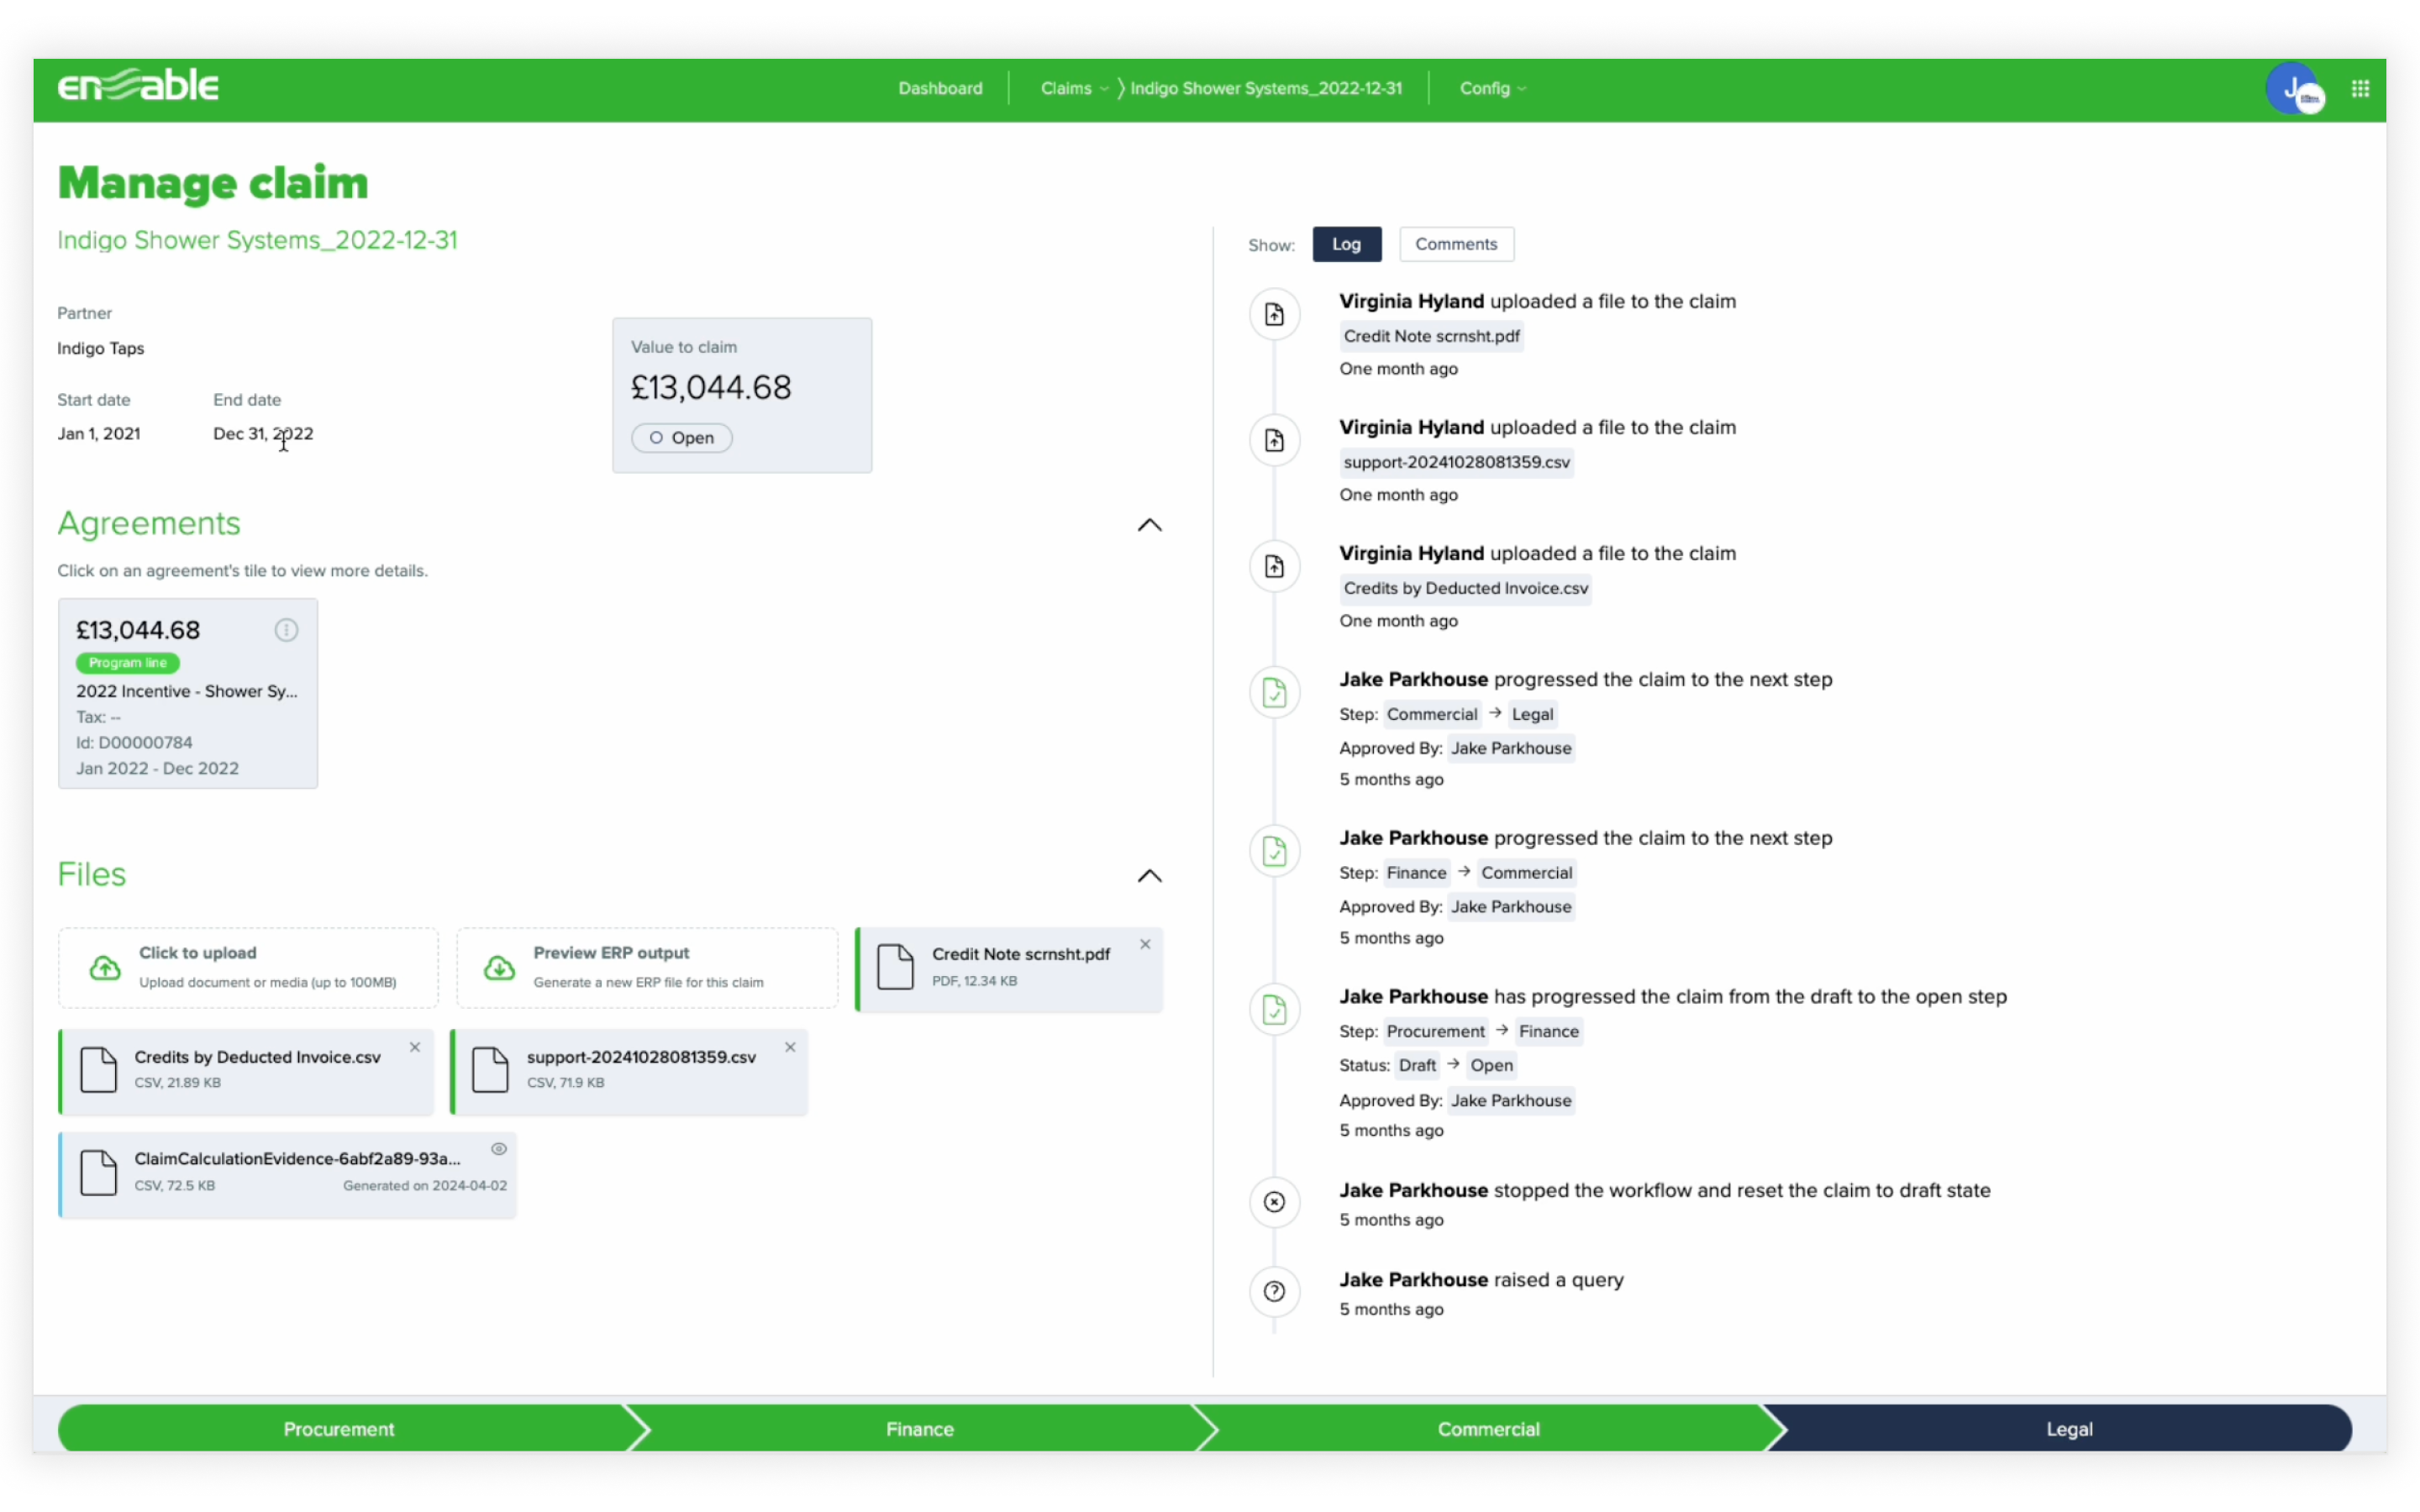
Claim Detail · Nov 2024
Claim detail before redesign

The starting point · Nov 2024 · Claims listing + detail page before the redesign

02 · Problem

A product that couldn't grow

📁

No file management

No way to split, reorganize, or manage claims.

🚫

No room to build

UI maxed out. No room to add new features at all.

🏗️

Broken architecture

No data link between agreements and claims. Design and engineering were both blocked.

03 · Discovery · Evidence

Letting data set the priority

FullStory — 1,700+ Sessions Analyzed
Configured default
Dashboard
users exit immediately
bypassed
Actual start page
Claims Listing
54.7%
of all sessions
Destination
Claim Detail
~76%
of listing visitors

Key finding: The dashboard was the default, but users bypassed it entirely. The detail page was the product.

Jira Demand Map — Top Customer Requests
Claim Splitting
#1
Claim Reversal
#2
Payment Allocation
#3
Bulk Actions
#4
Custom File Columns
#5
The Decision

Start with the claim detail page: not a UI refresh, but a full system redesign.

04 · Foundation · Jan – Mar 2025

Rebuilding the core, and how the team works

📐

Scalable Layout Architecture

Every decision stress-tested against 300+ agreements on a single claim.

🏢

Enterprise-Ready from Day 1

Pain points from Currys (20–300+ agreements/claim) and City Electrical (40+) drove every design review.

🎨

Design System First

First surface to adopt Enable's design system in production.

🧩

Shared Component Library

I specced, tech lead built. Cut implementation time for every team after.

04 · Foundation · Design Process

Three rounds before we had the right answer

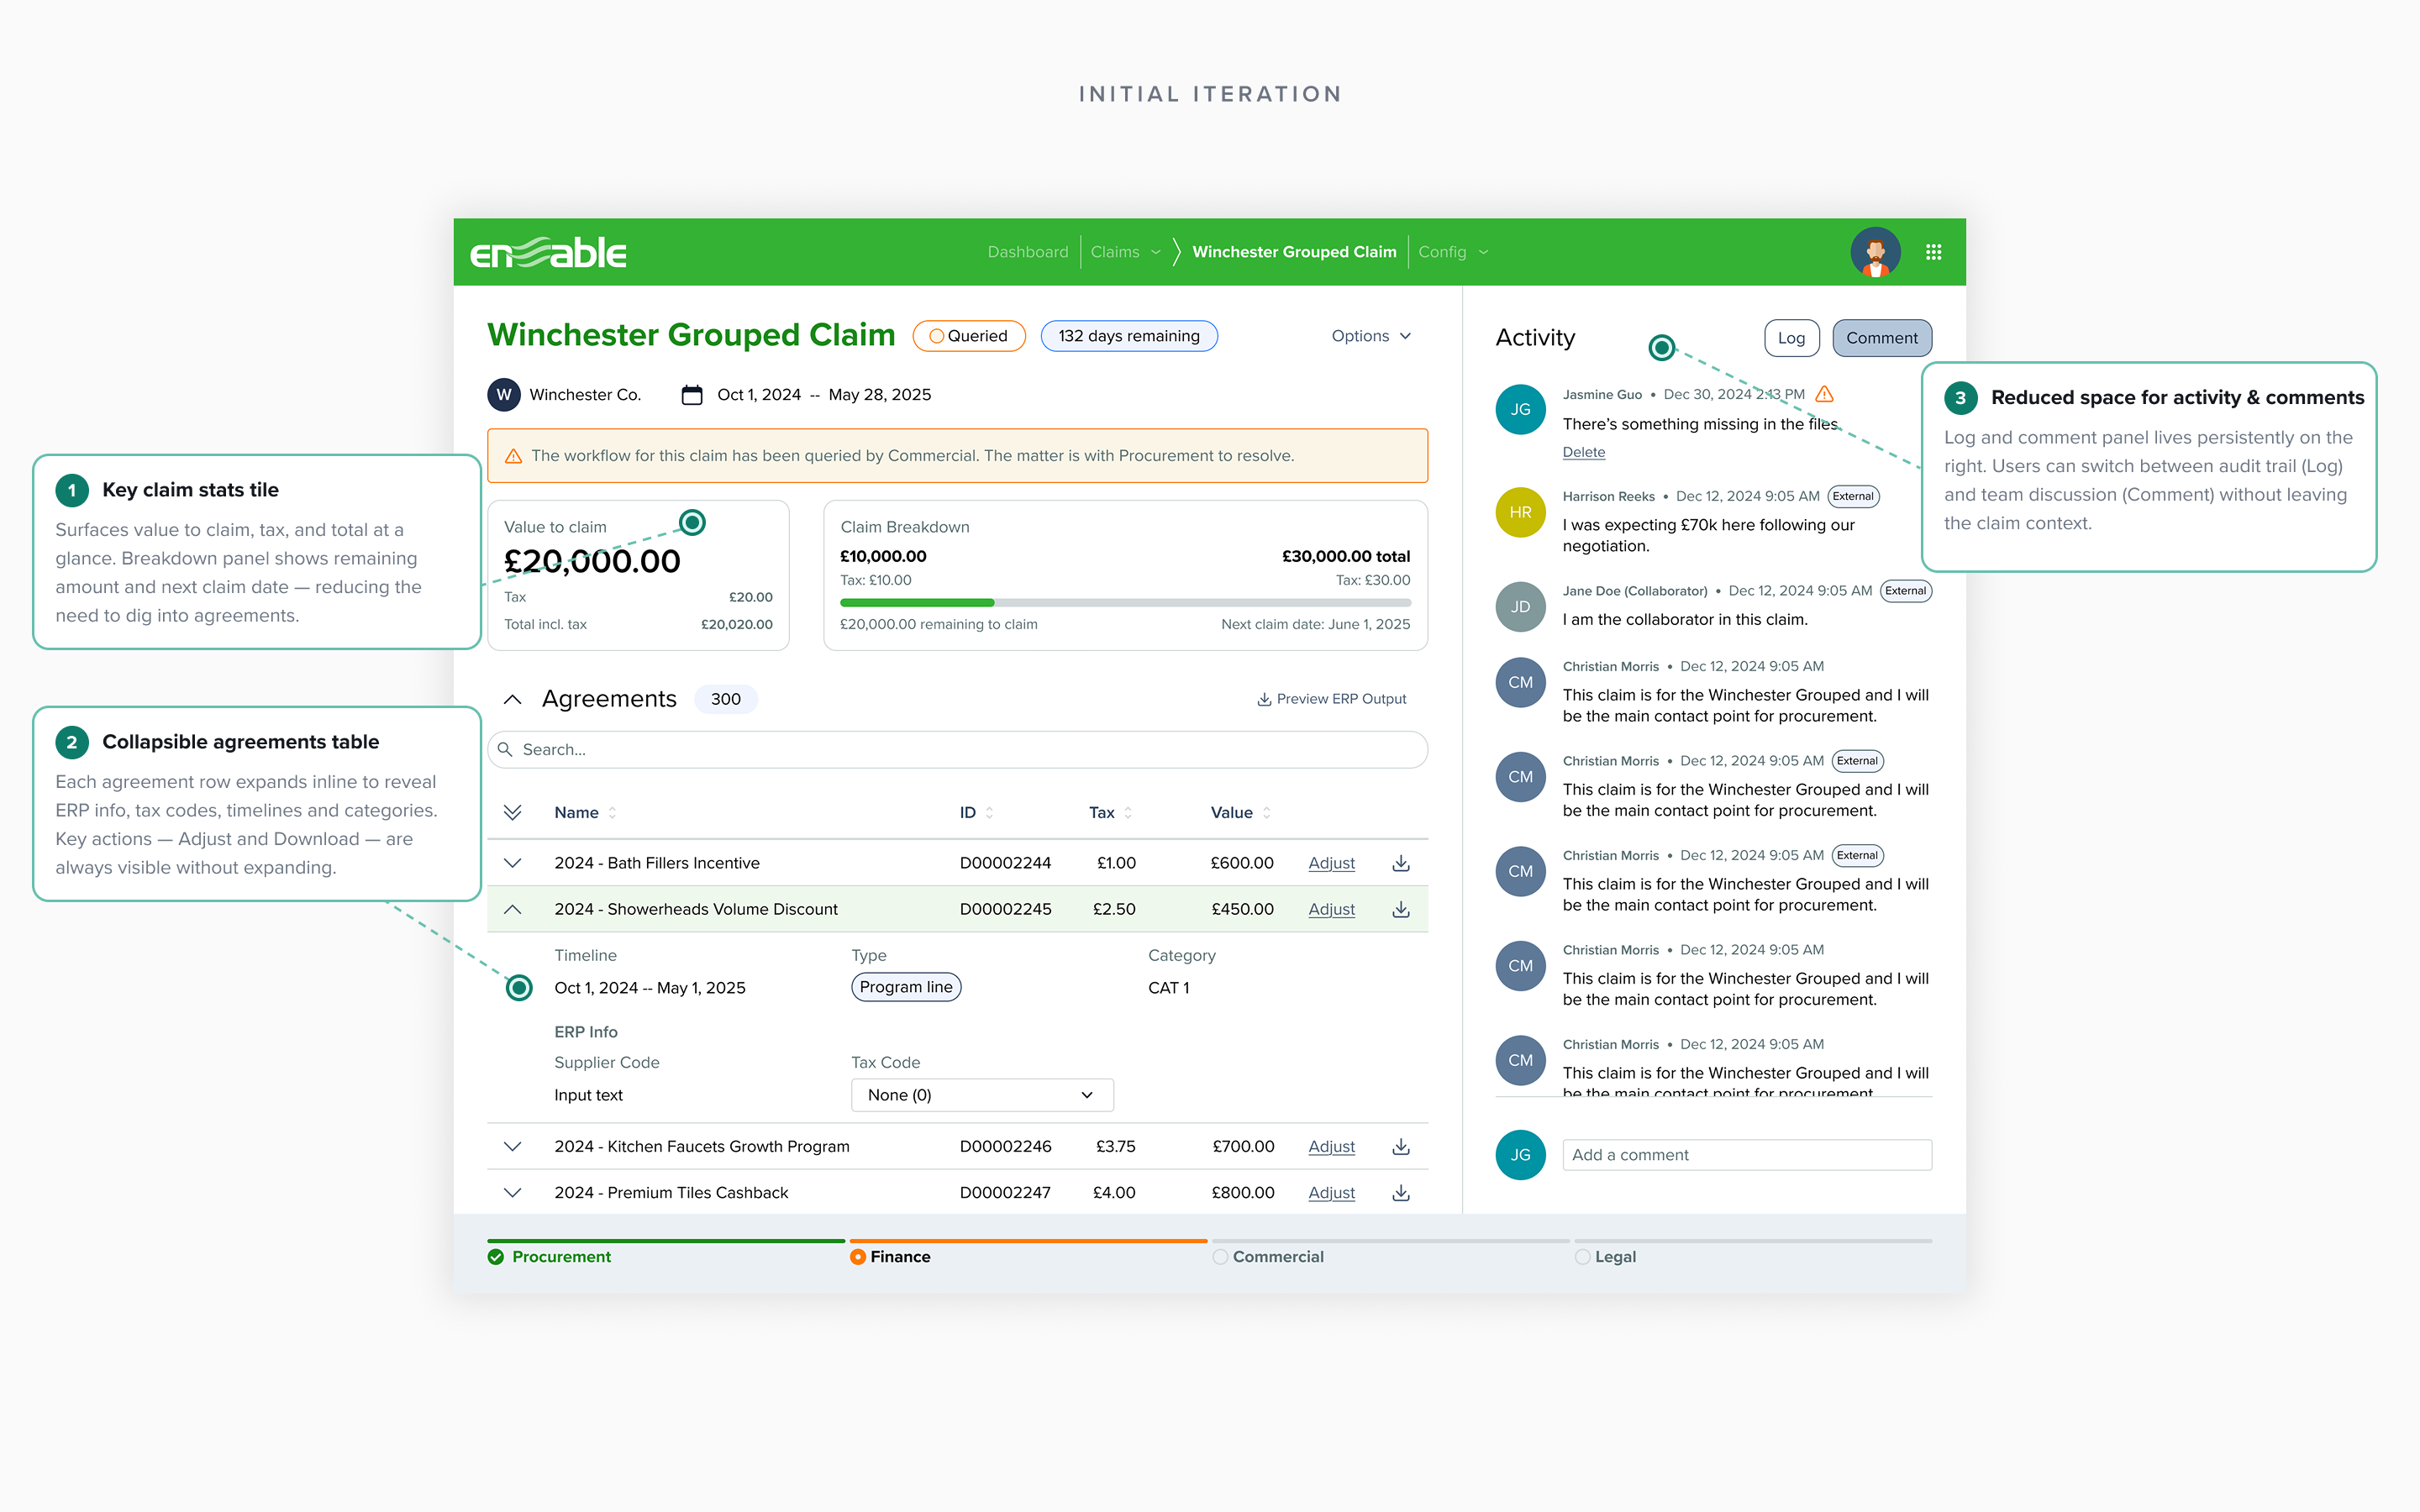
Iteration 1 — Initial Layout
Round 1
Initial Iteration
Collapsed when agreements exceeded visible space.
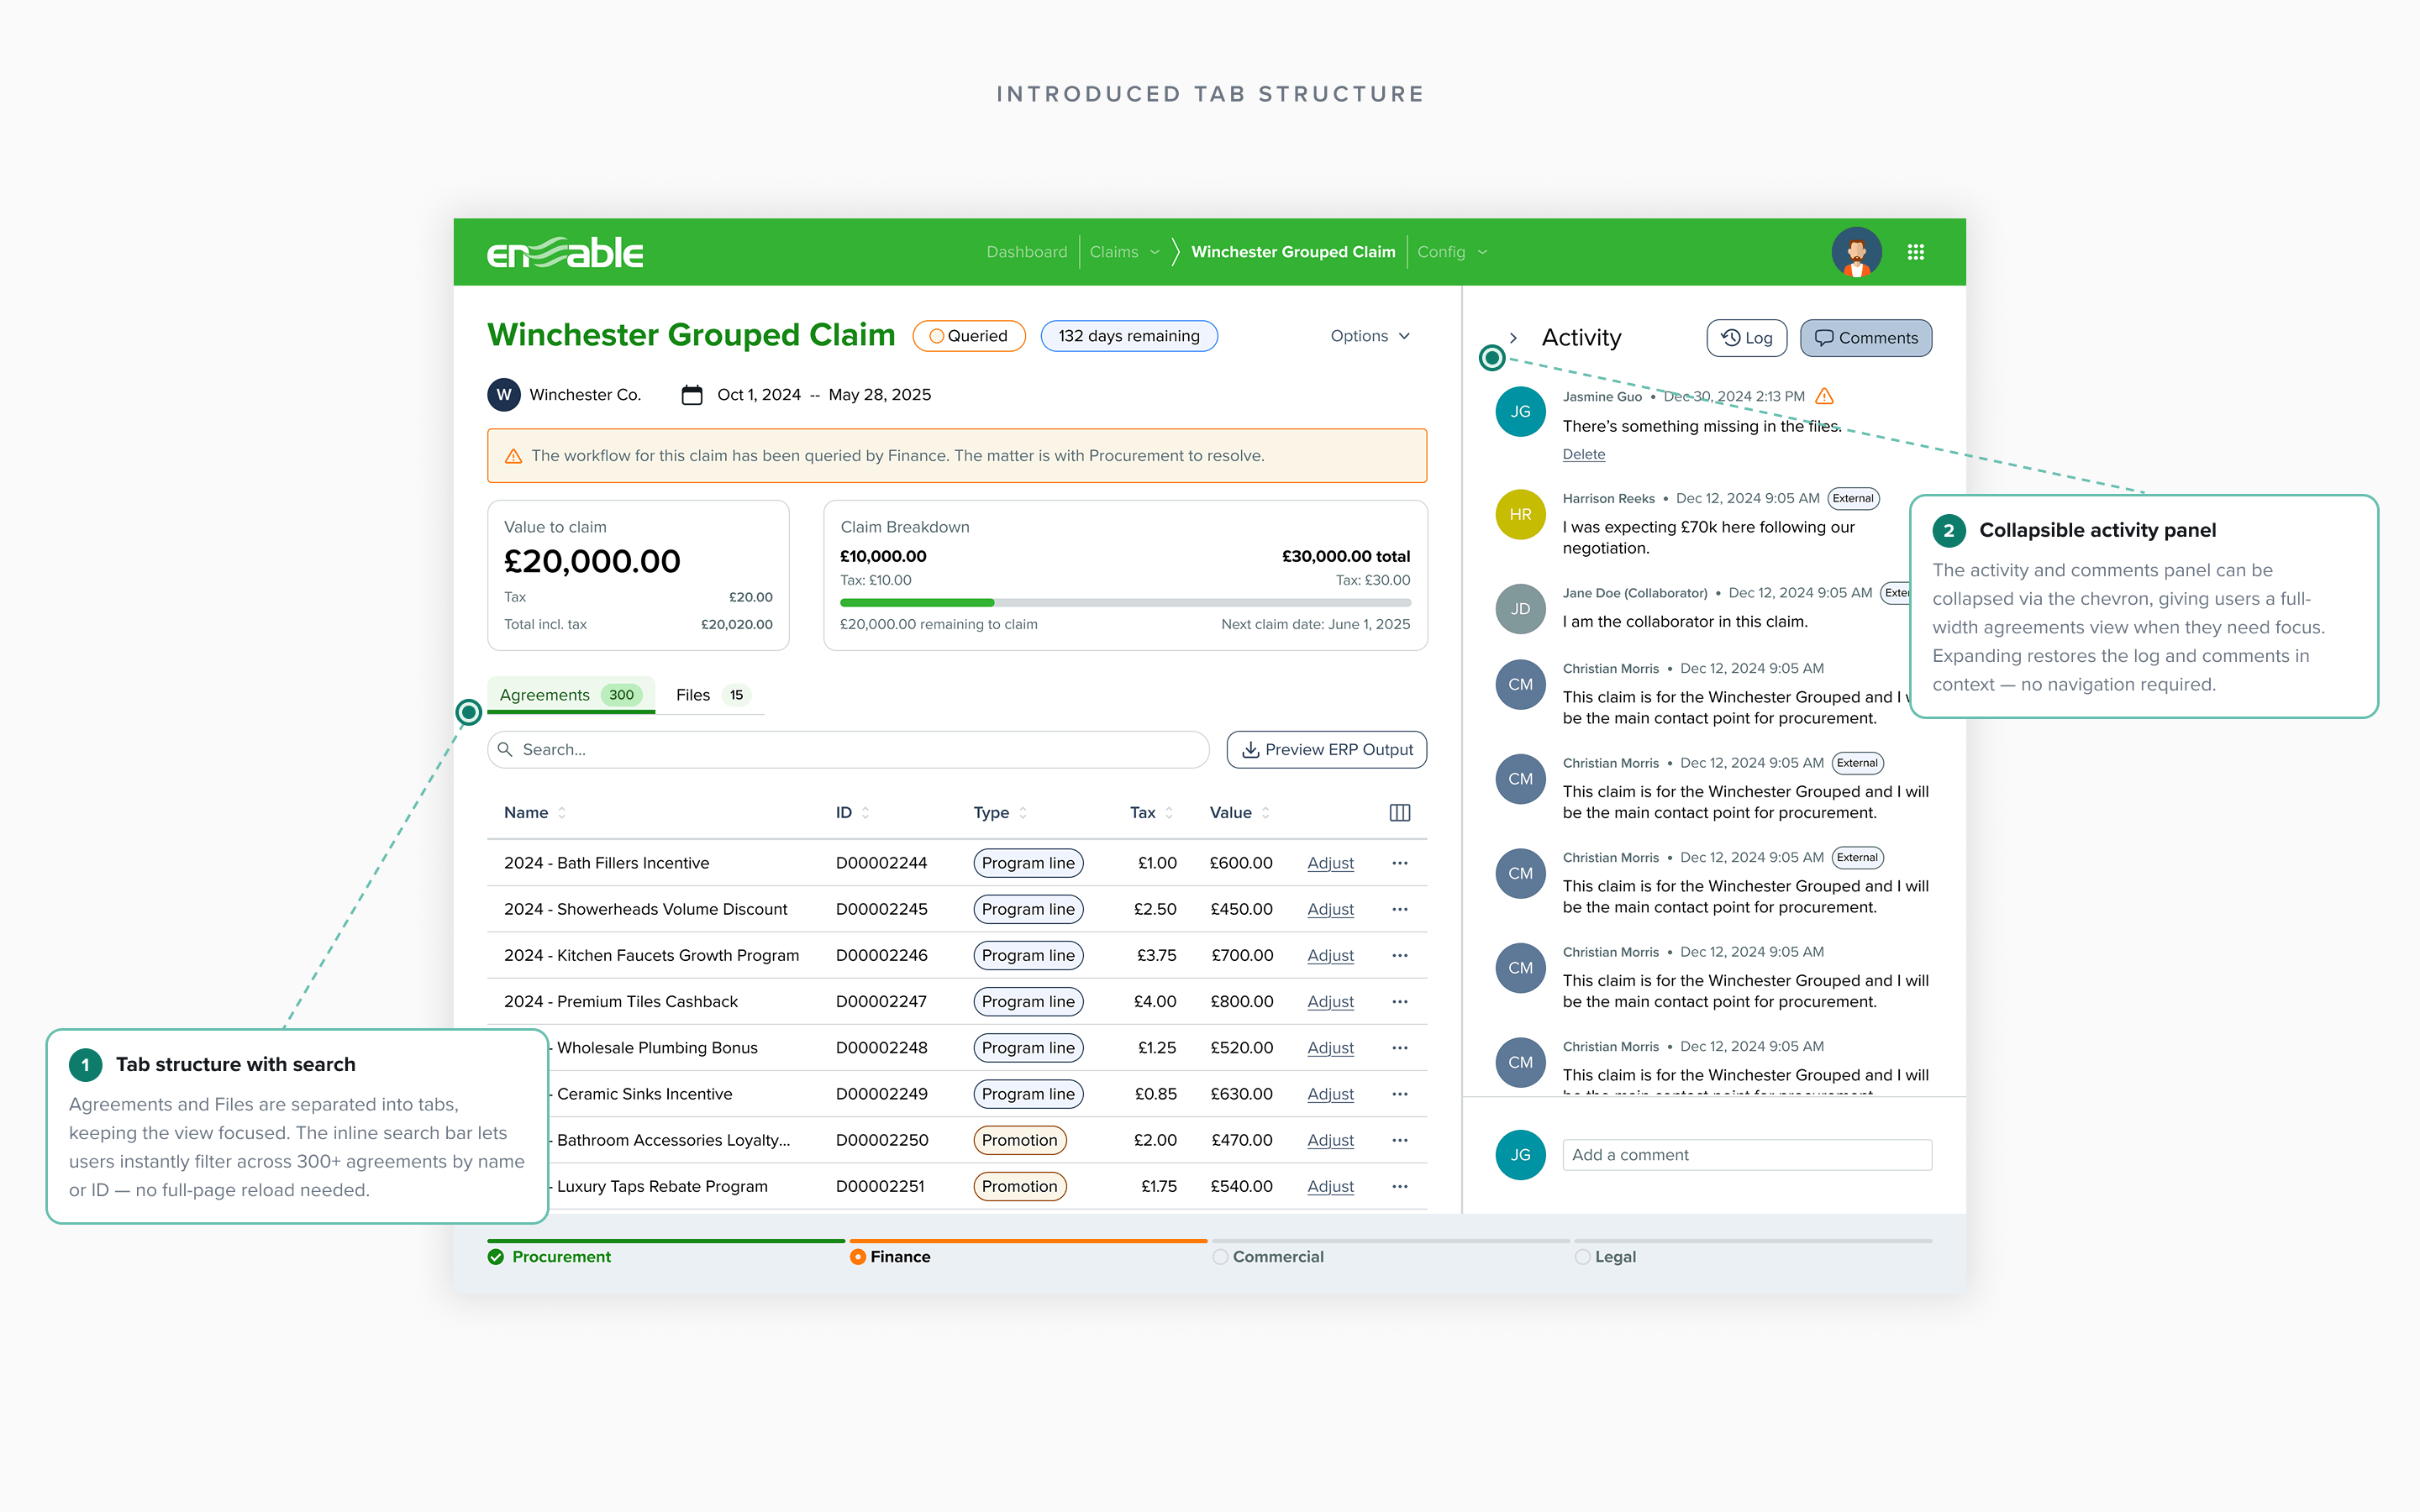
Iteration 2 — Tab Structure
Round 2
Tab Structure
Tabs isolated domains. Almost. Header too heavy.
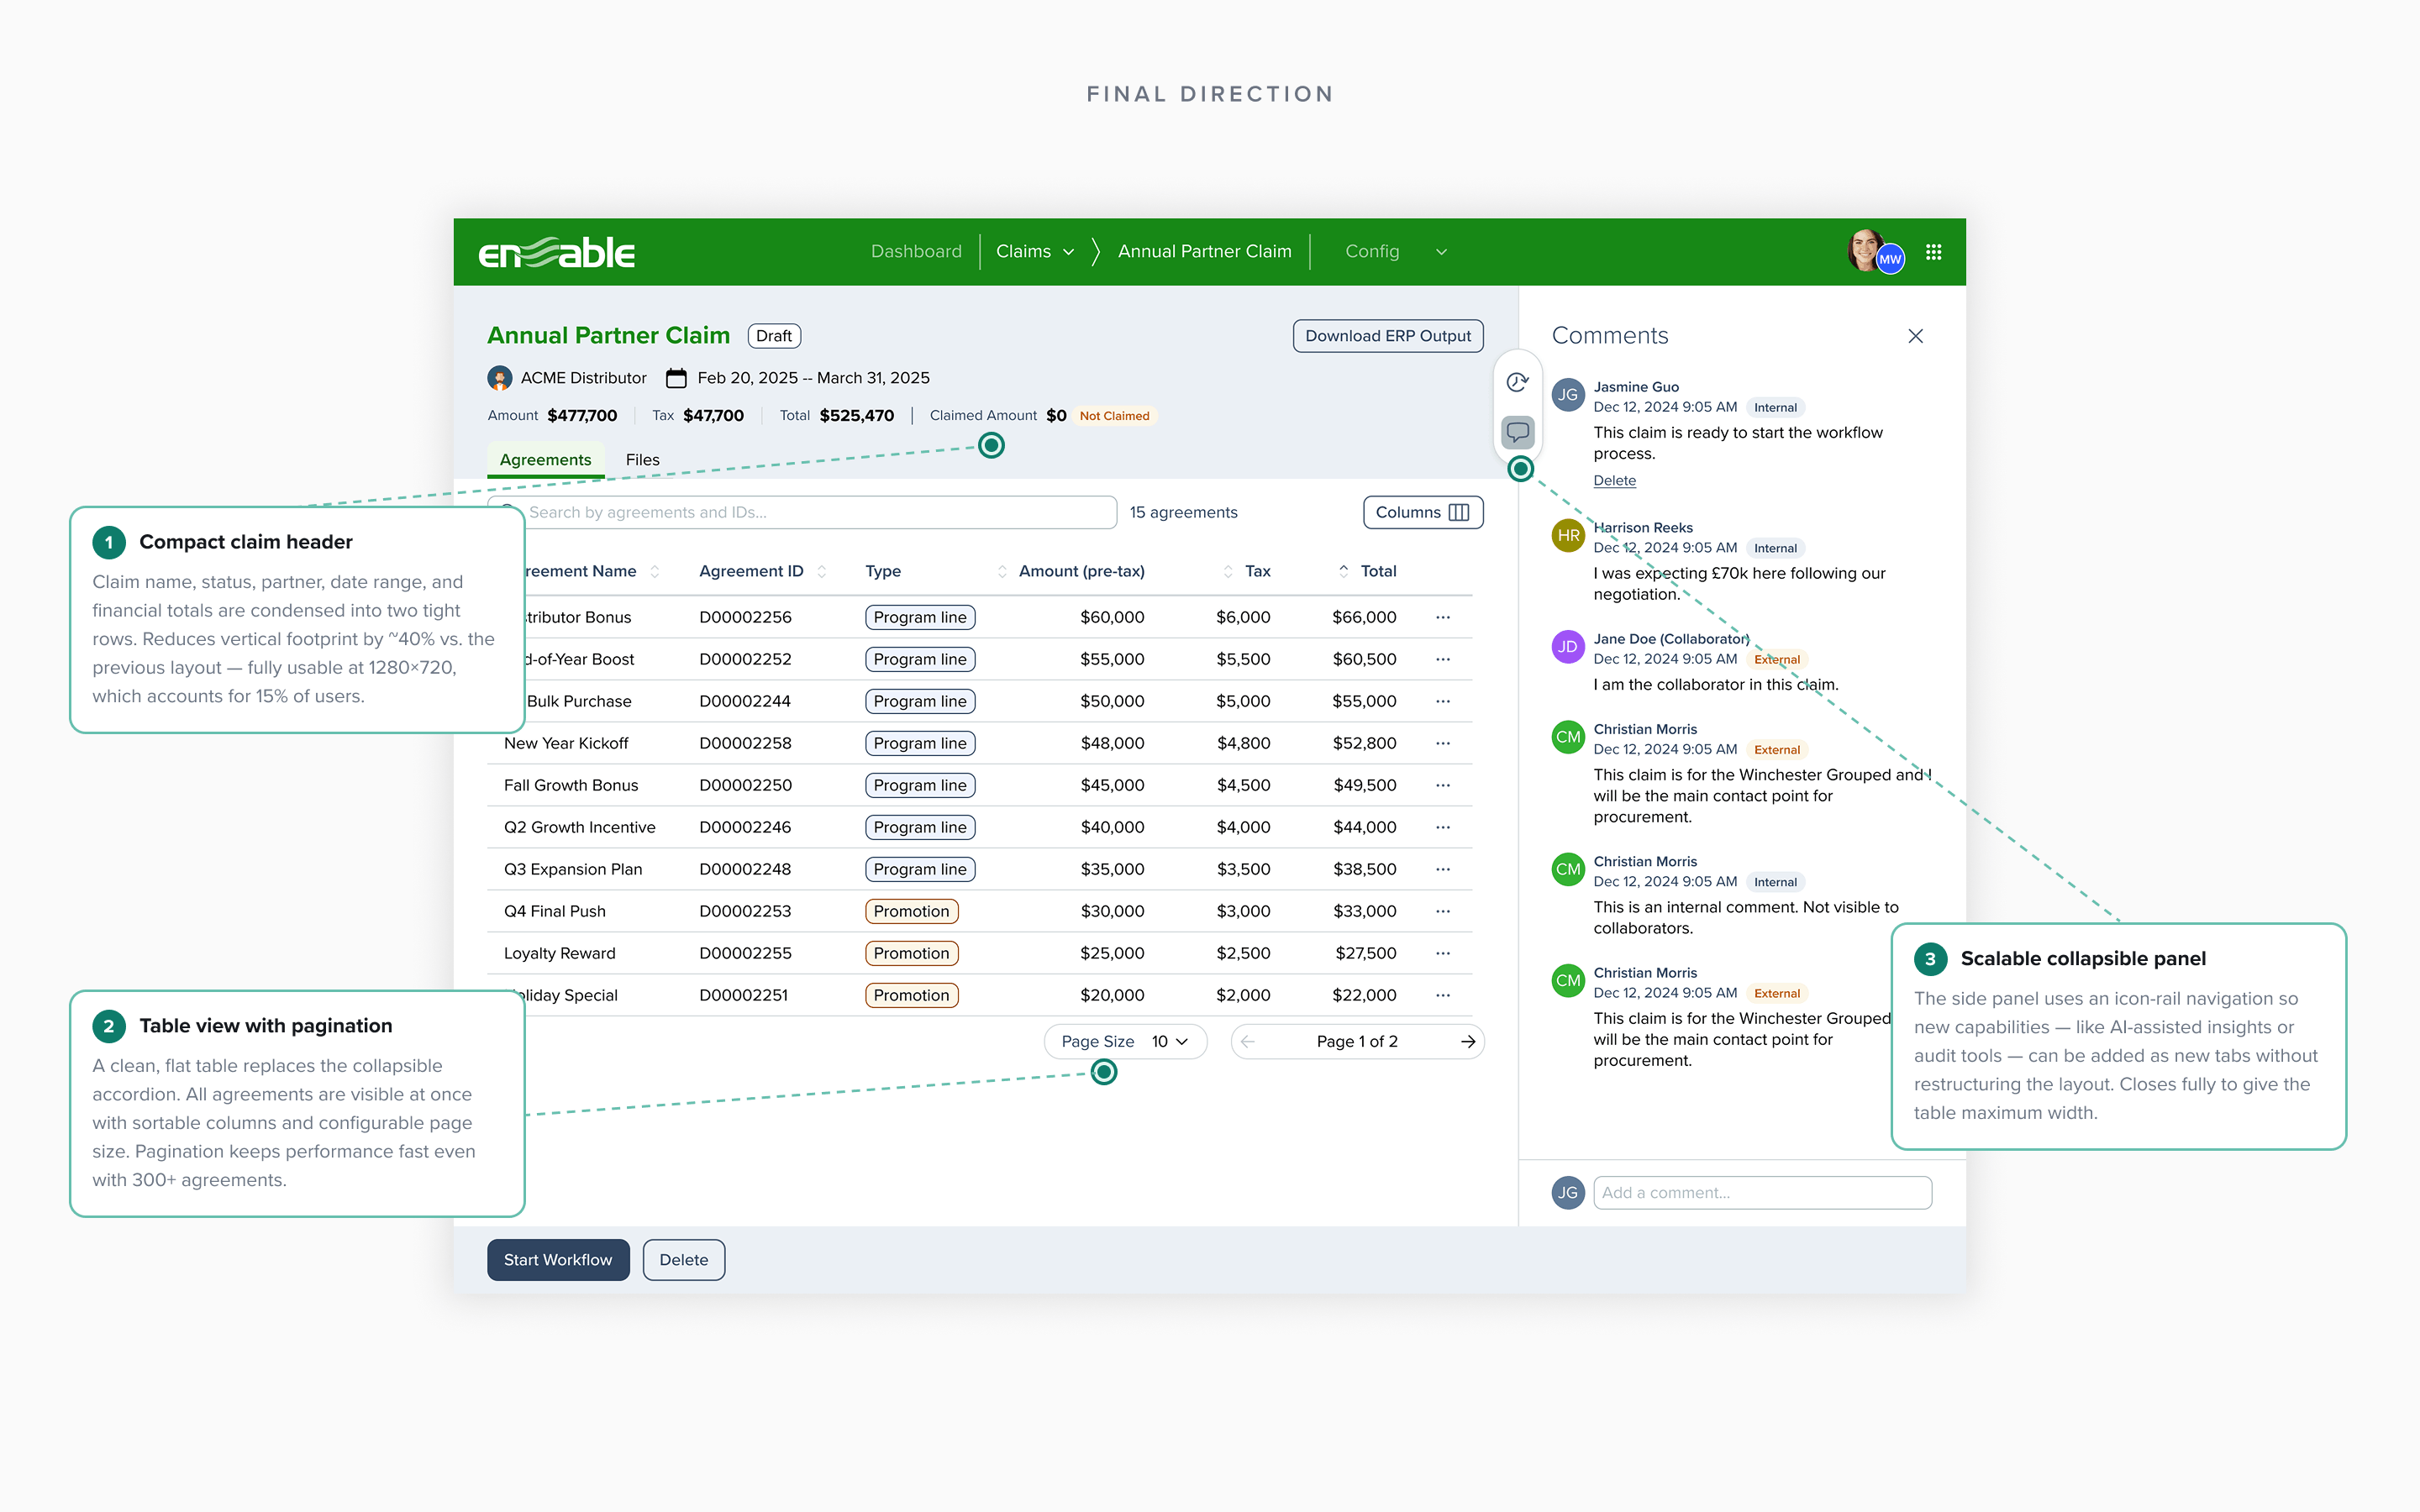
Iteration 3 — Final Direction
Final
Final Direction
Compact header. Paginated table for 500+ agreements. Collapsible side panel.
04 · Foundation · The Pivot

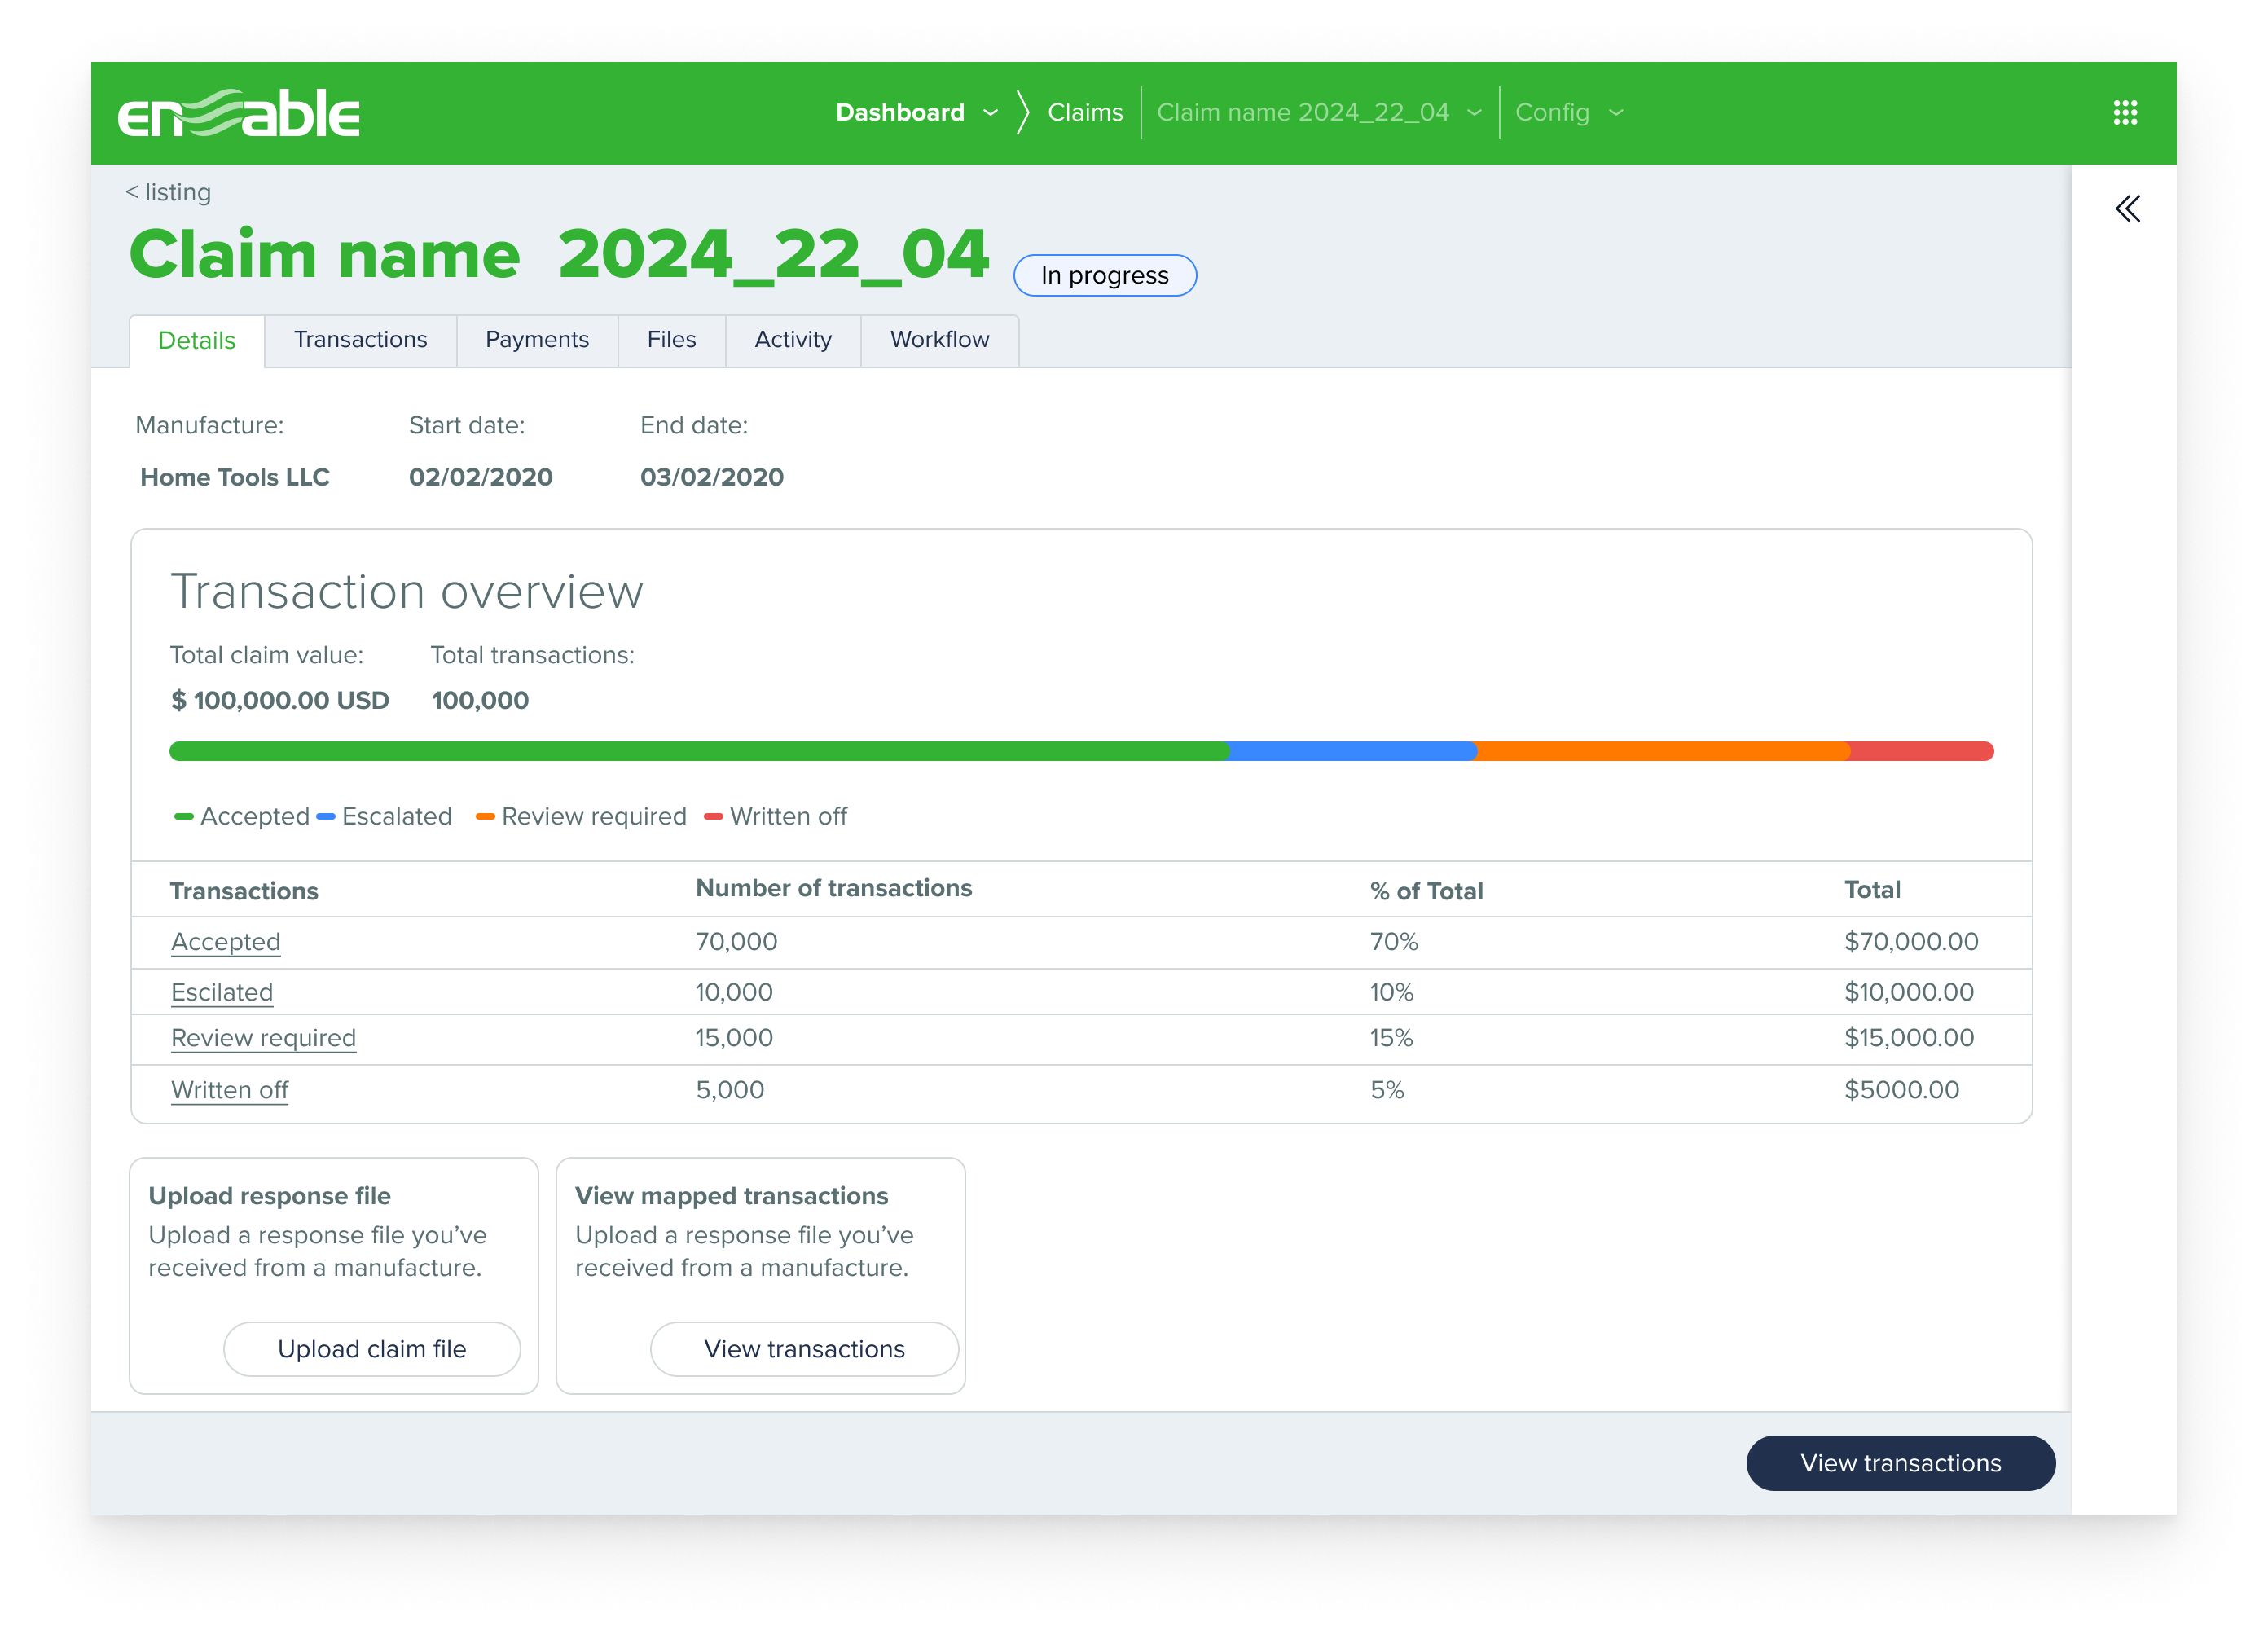
Stakeholders wanted charts.
Users wanted clarity.

What Shaped Rounds 1 + 2
Claim Detail — Proposed Design
Overview
Agreements
Timeline
KPI cards · status charts · overview tab: "visually engaging for sales demos"
Actual stakeholder-proposed design — dashboard with charts and KPI overview hover to reveal
What 11 Customers Actually Said

"The charts don't help me — I need the actual numbers and whether files are attached."

— Category manager, enterprise customer

"This is distracting. I go straight to the data every time. An overview tab just adds a click."

— Finance team lead
How: Survey + Loom to 11 customers. 9 of 11 submitted screen recordings. All went straight to the data.
The Pivot

I recommended dropping visualization and rebuilding around a data-dense table. PM pushed back: "it's a sales demo feature." We tested 4 stakeholders on the new direction.

0 / 4

Zero task failures on the data table — same customers who failed the chart design. PM backed the pivot.

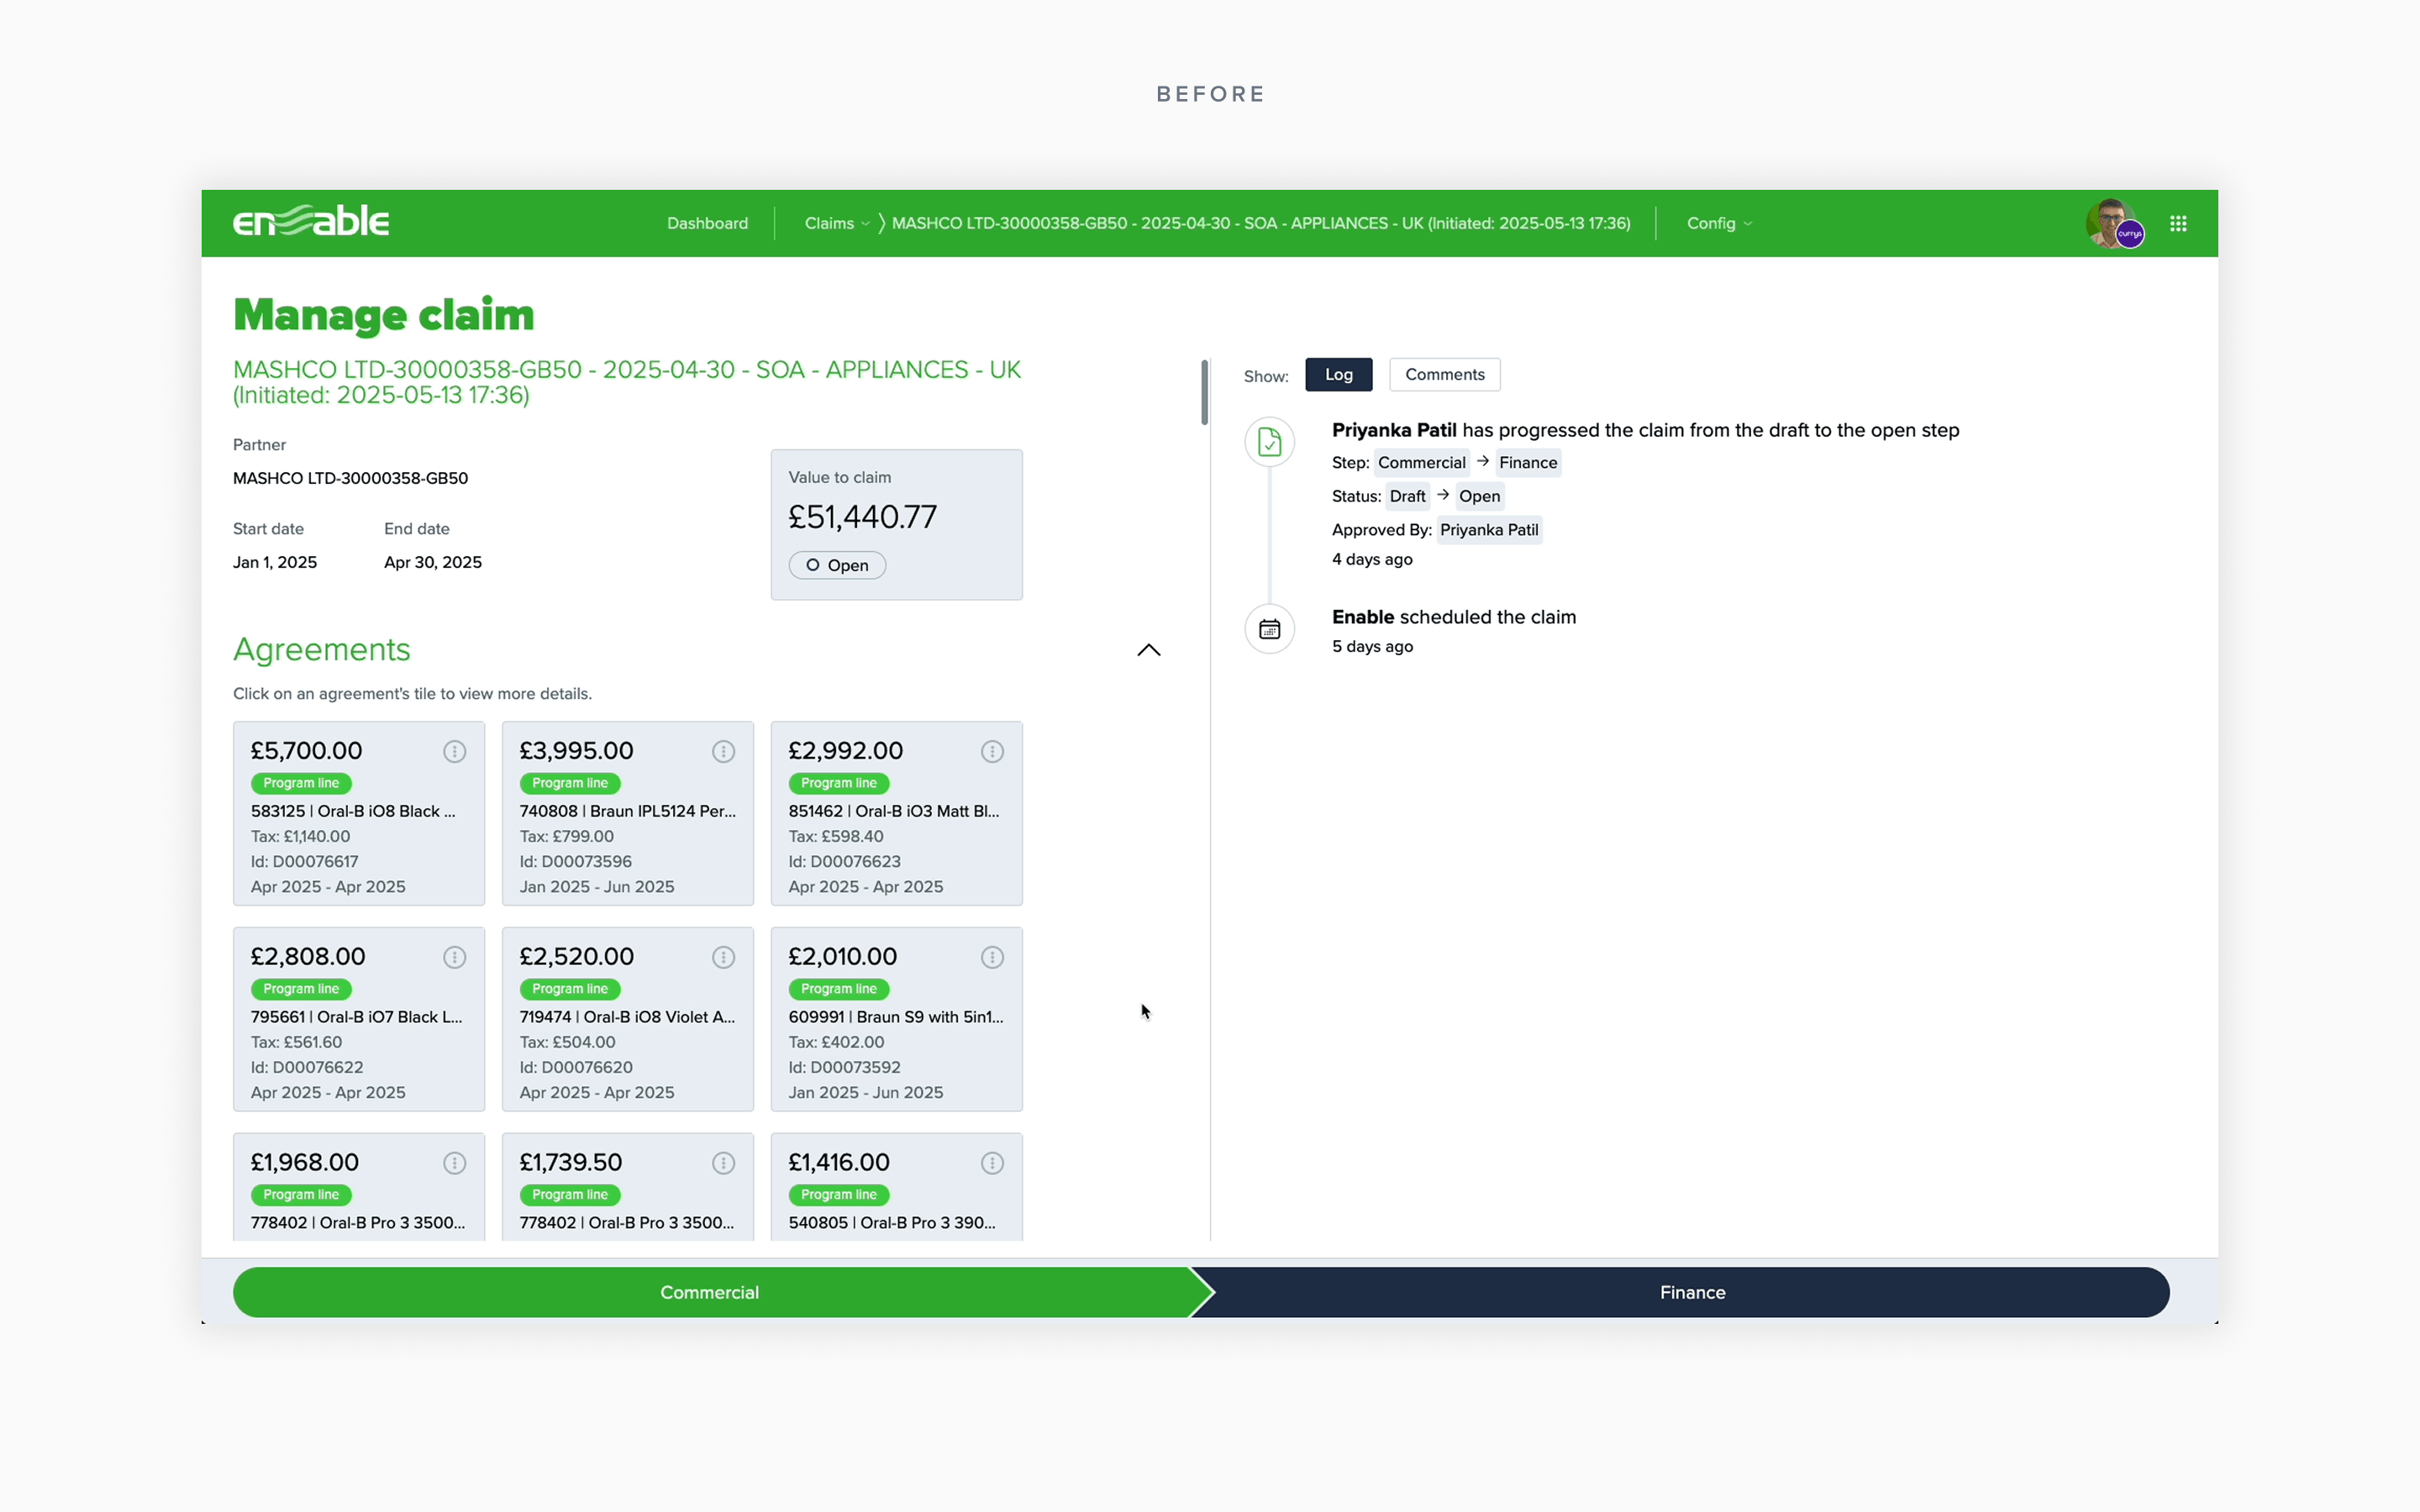
04 · Foundation Before — Nov 2024

The product that couldn't grow

Claim detail page before redesign — Nov 2024
Unreadable GUID titleNo human-readable ID, no navigable breadcrumb
Panel maxed outLog + Comments only. No room for splitting, payments, or files
Card grid layoutNo search, sort, or bulk select. Breaks at 10+ agreements
Collapsible sections, already at capacityNo room for future workflow features above the fold
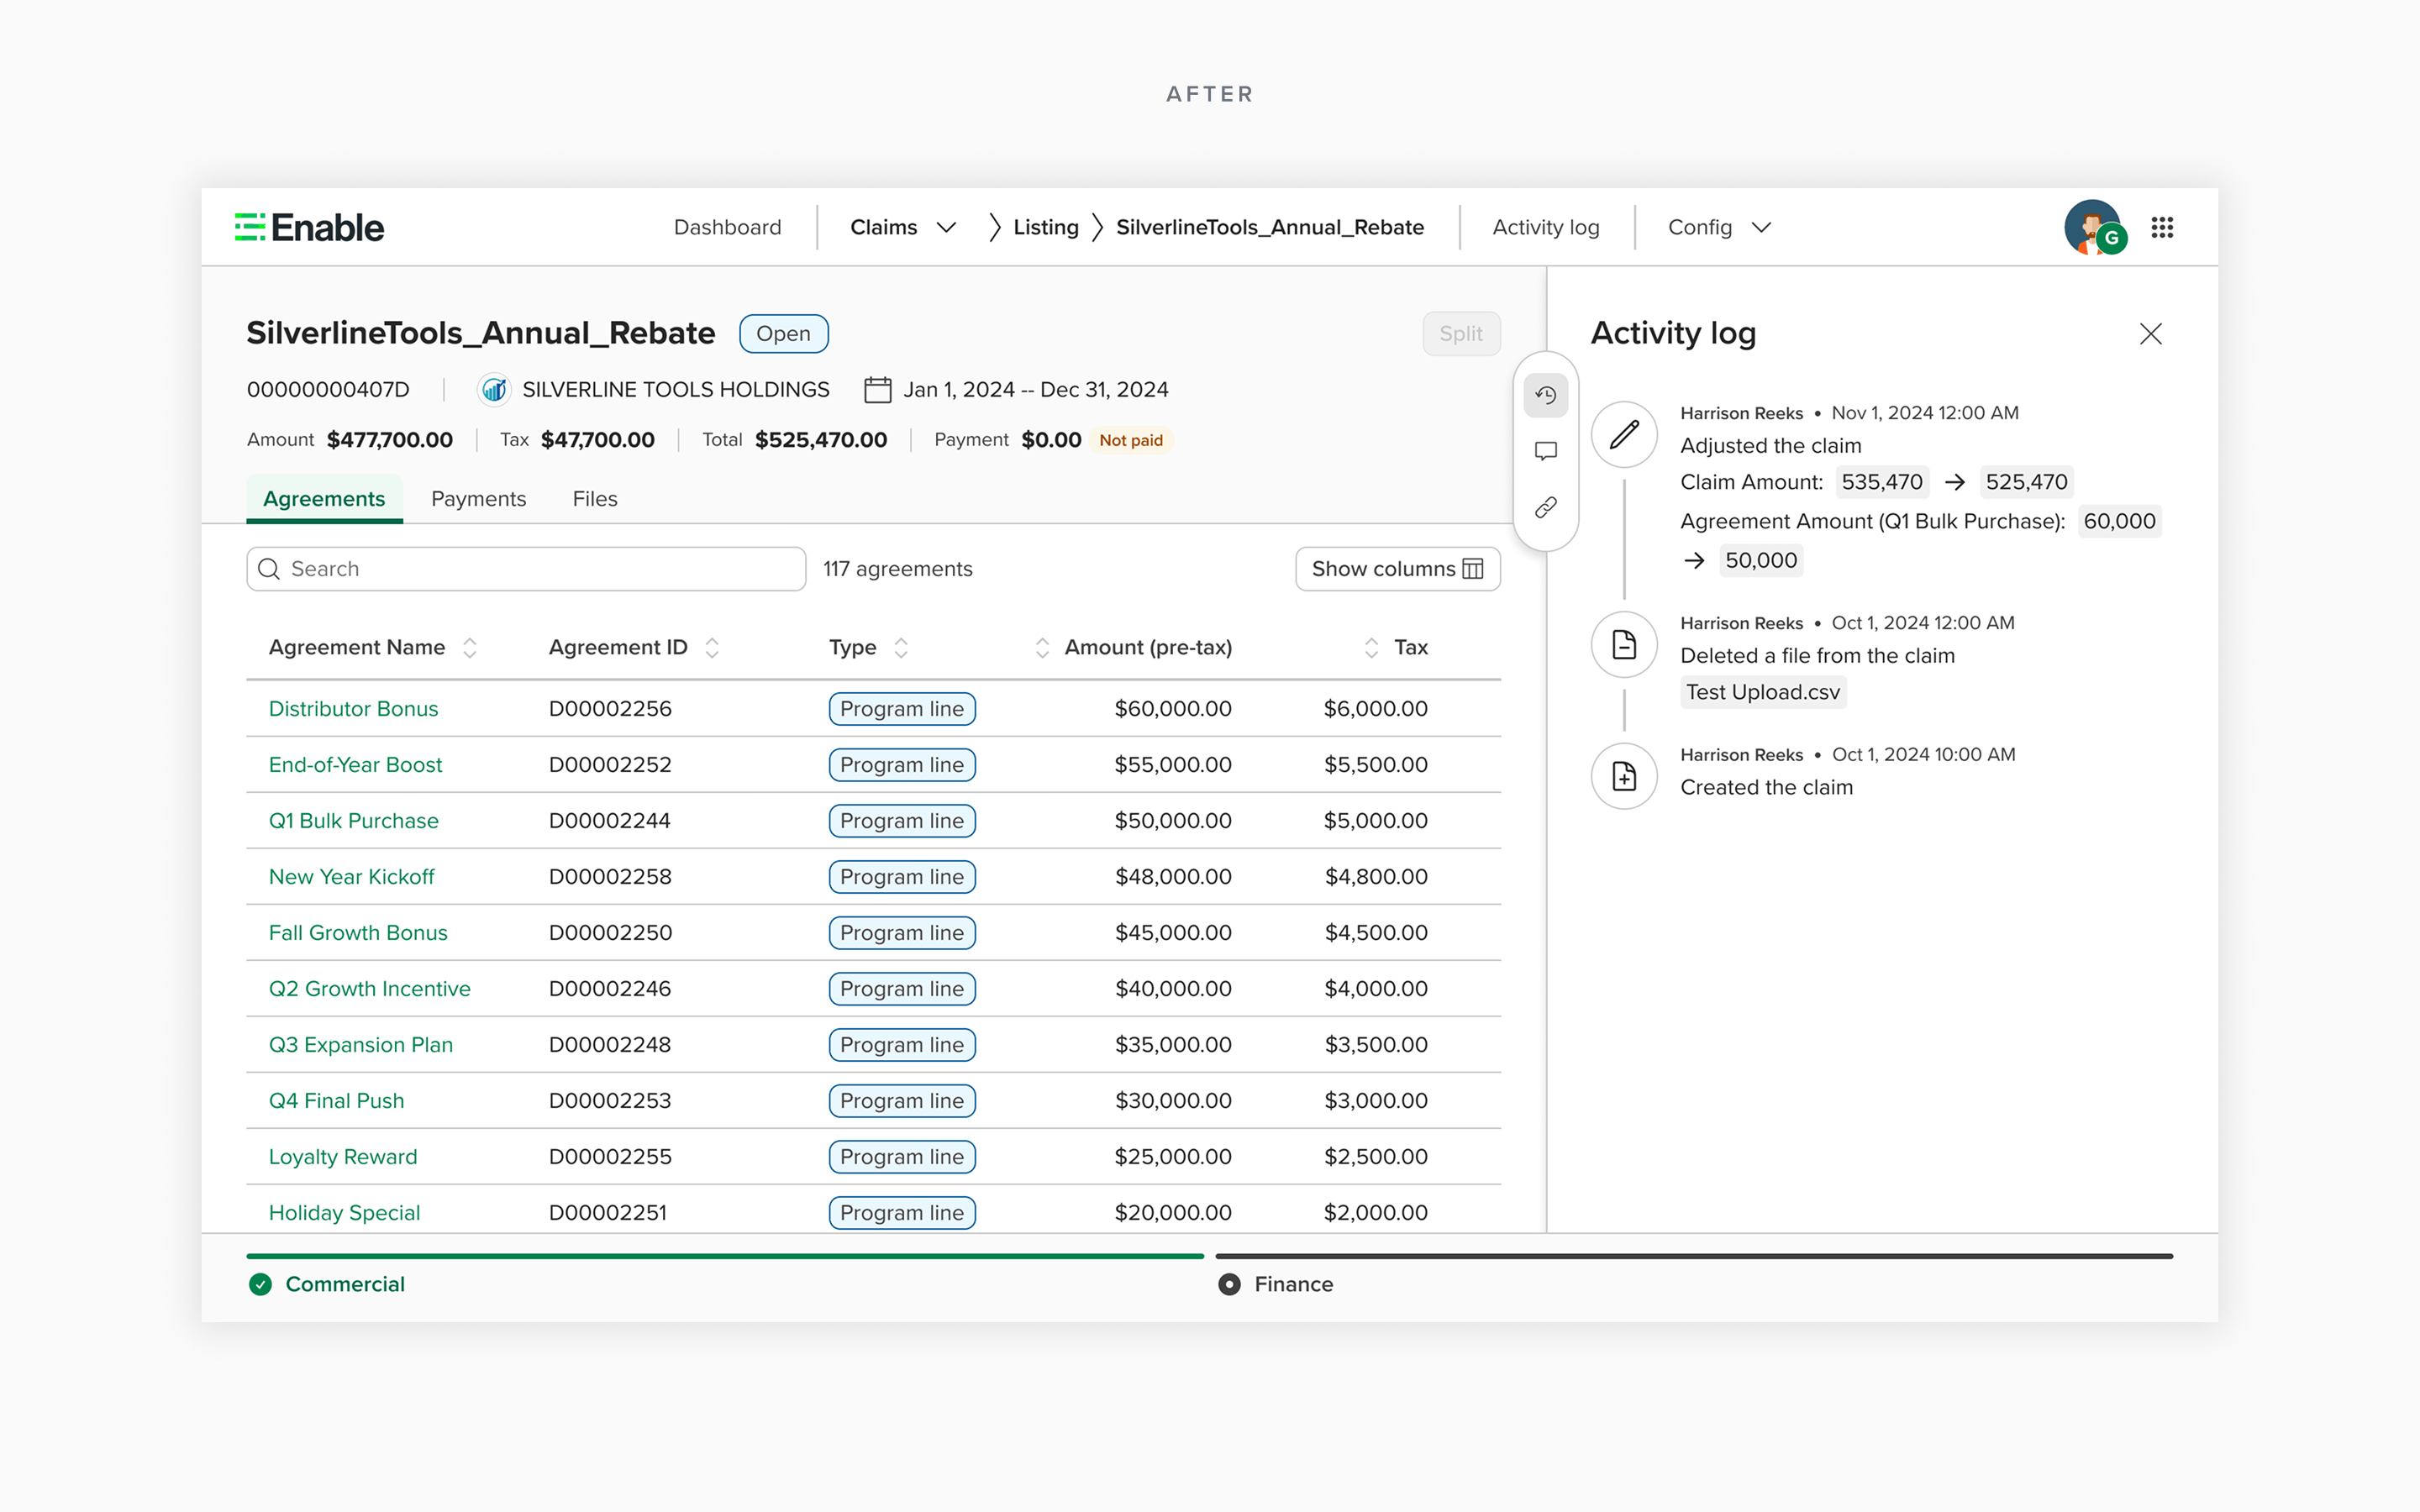
04 · Foundation After — Apr 2025 · Why each decision was made

Every element here for a reason

Claim detail page after redesign — Apr 2025
Unique ID + breadcrumbHuman-readable reference, replicable in ERP audit trails
Extensible tab structureCity Electrical had 42+ agreement types. A flat scroll caused category managers to miss approvals. Tabs isolate each domain; every future feature gets a slot without rebuilding.
Data table with search + sortParfetts' ops team was exporting to CSV and re-sorting in Excel every cycle. We brought that exact interaction model into the product to eliminate the export step.
Expandable activity logCurrys' finance team flagged that comments got buried mid-review. Conversations lost, approvals stalled. Persistent panel keeps the full thread visible without leaving the agreements table.
05 · Technical Depth · Workshop Artifacts

Inside the engineering workshops

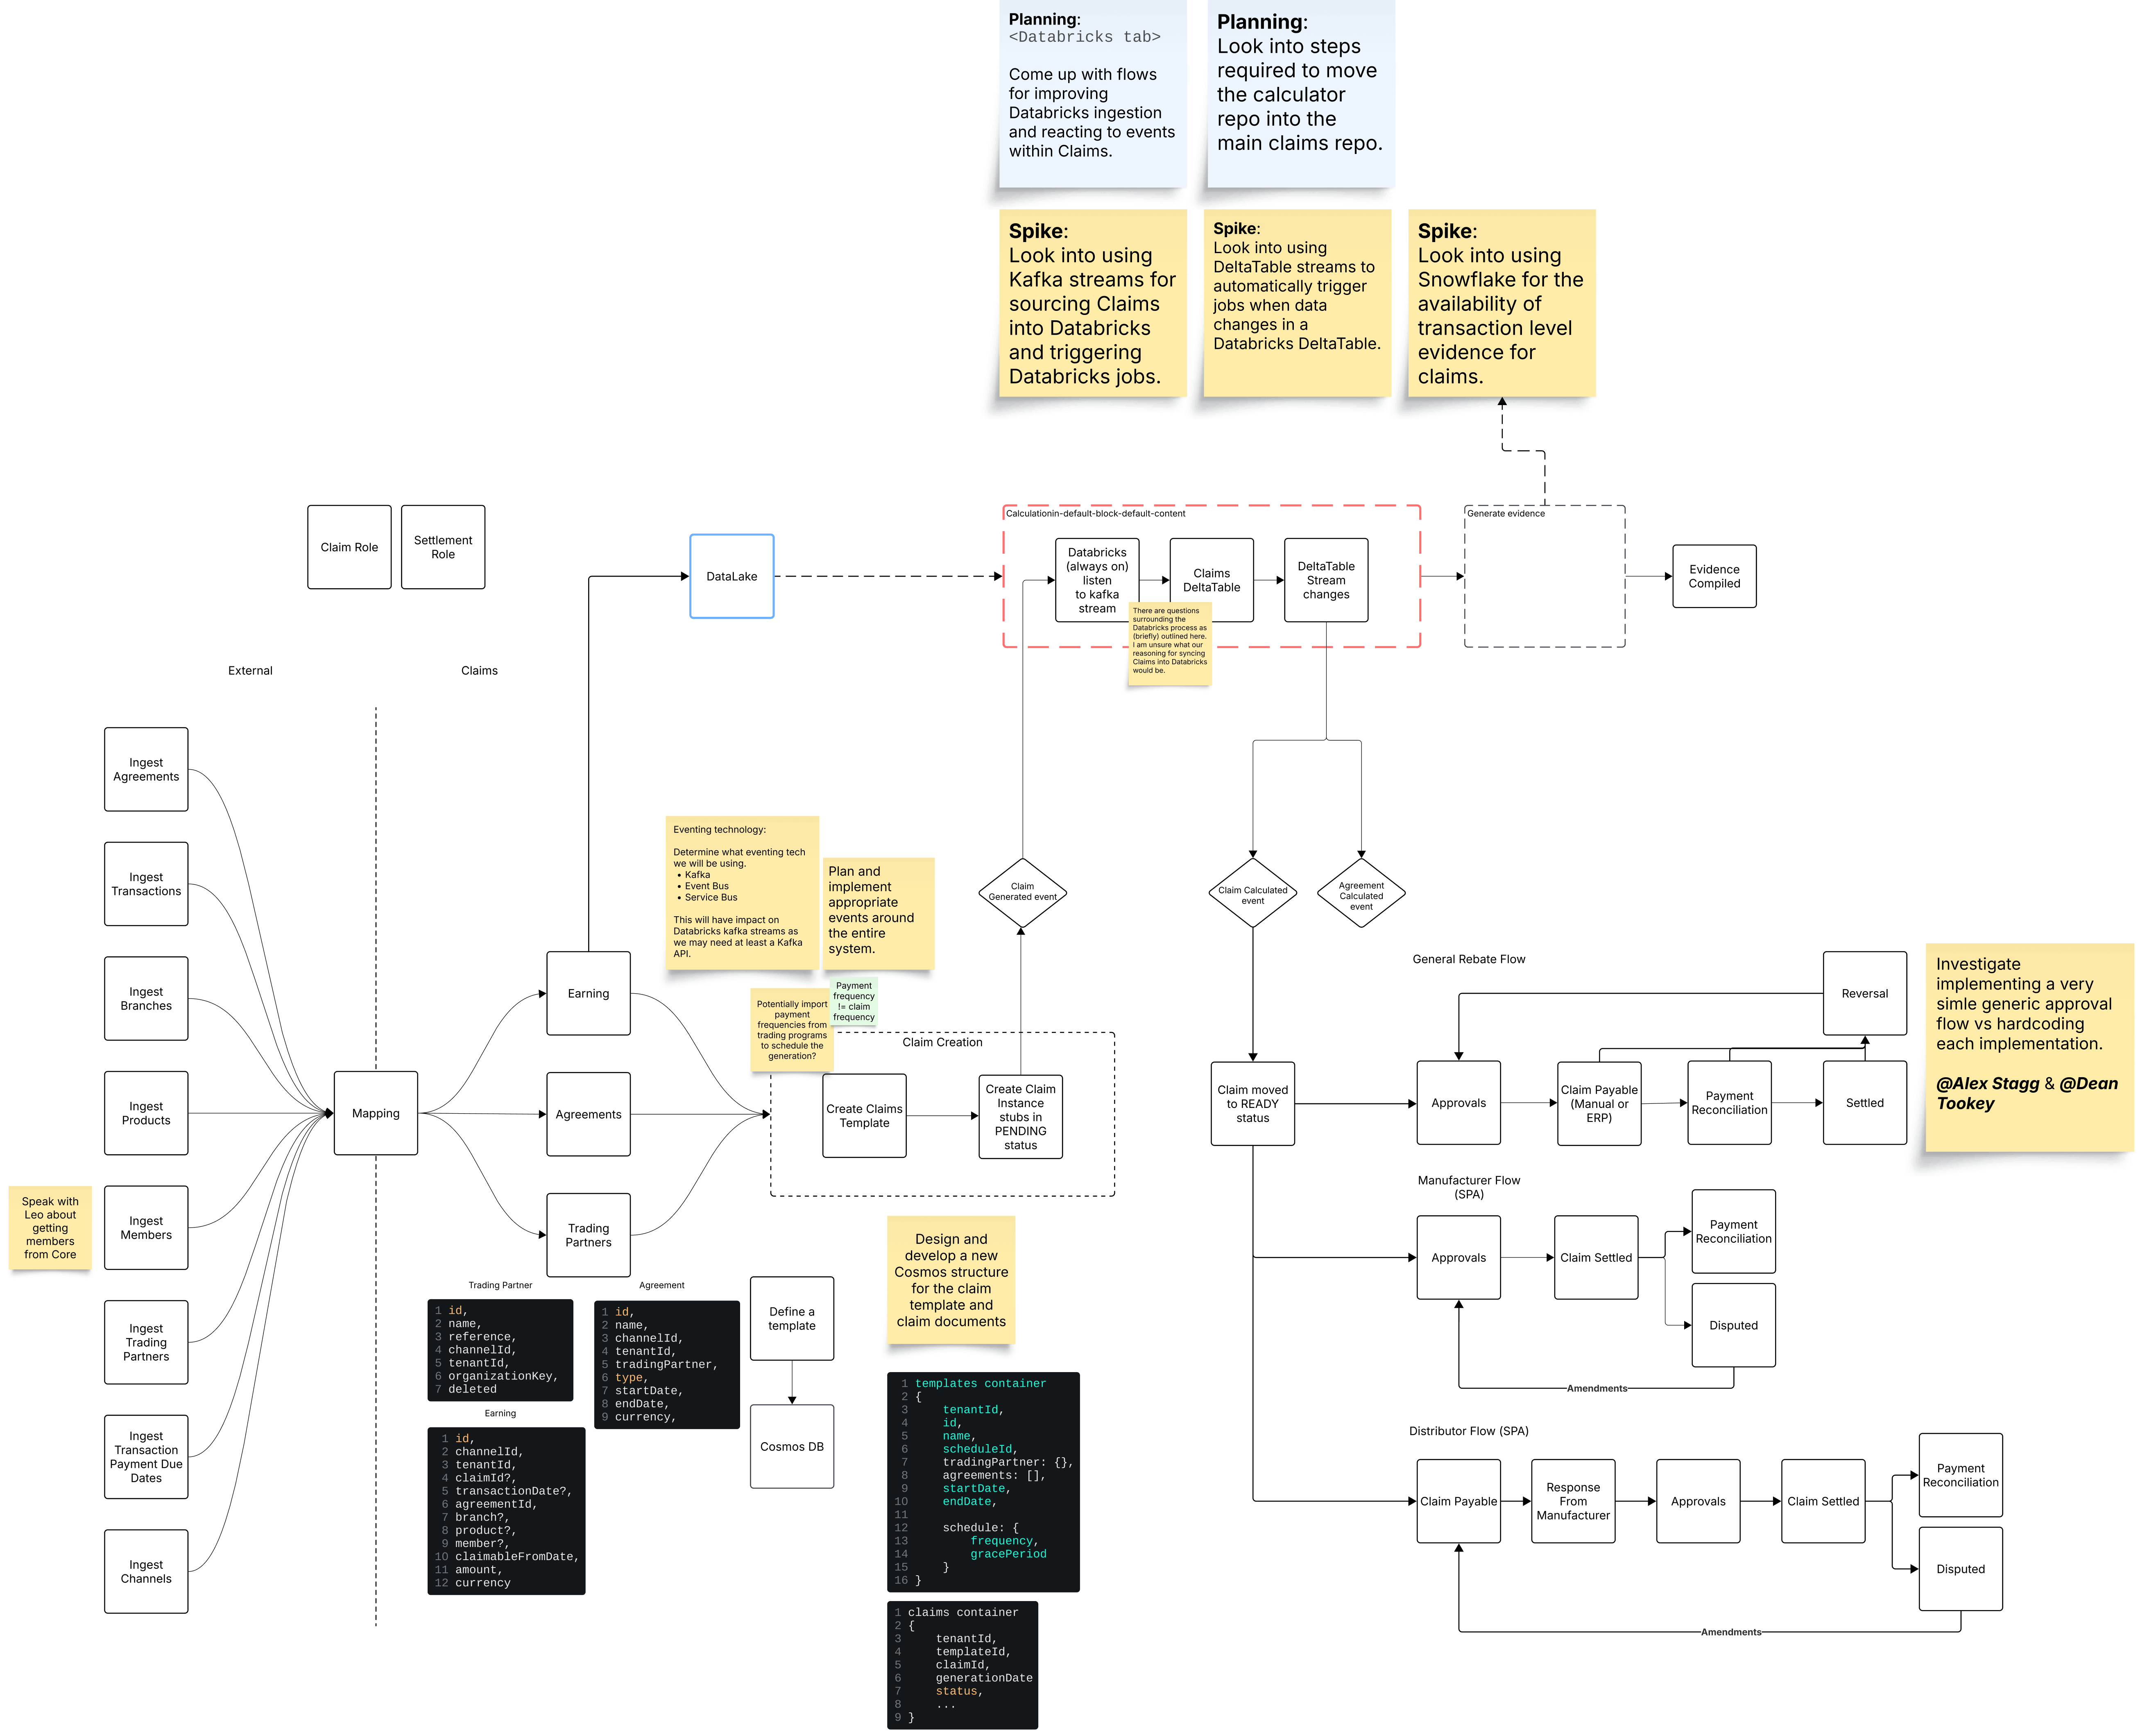
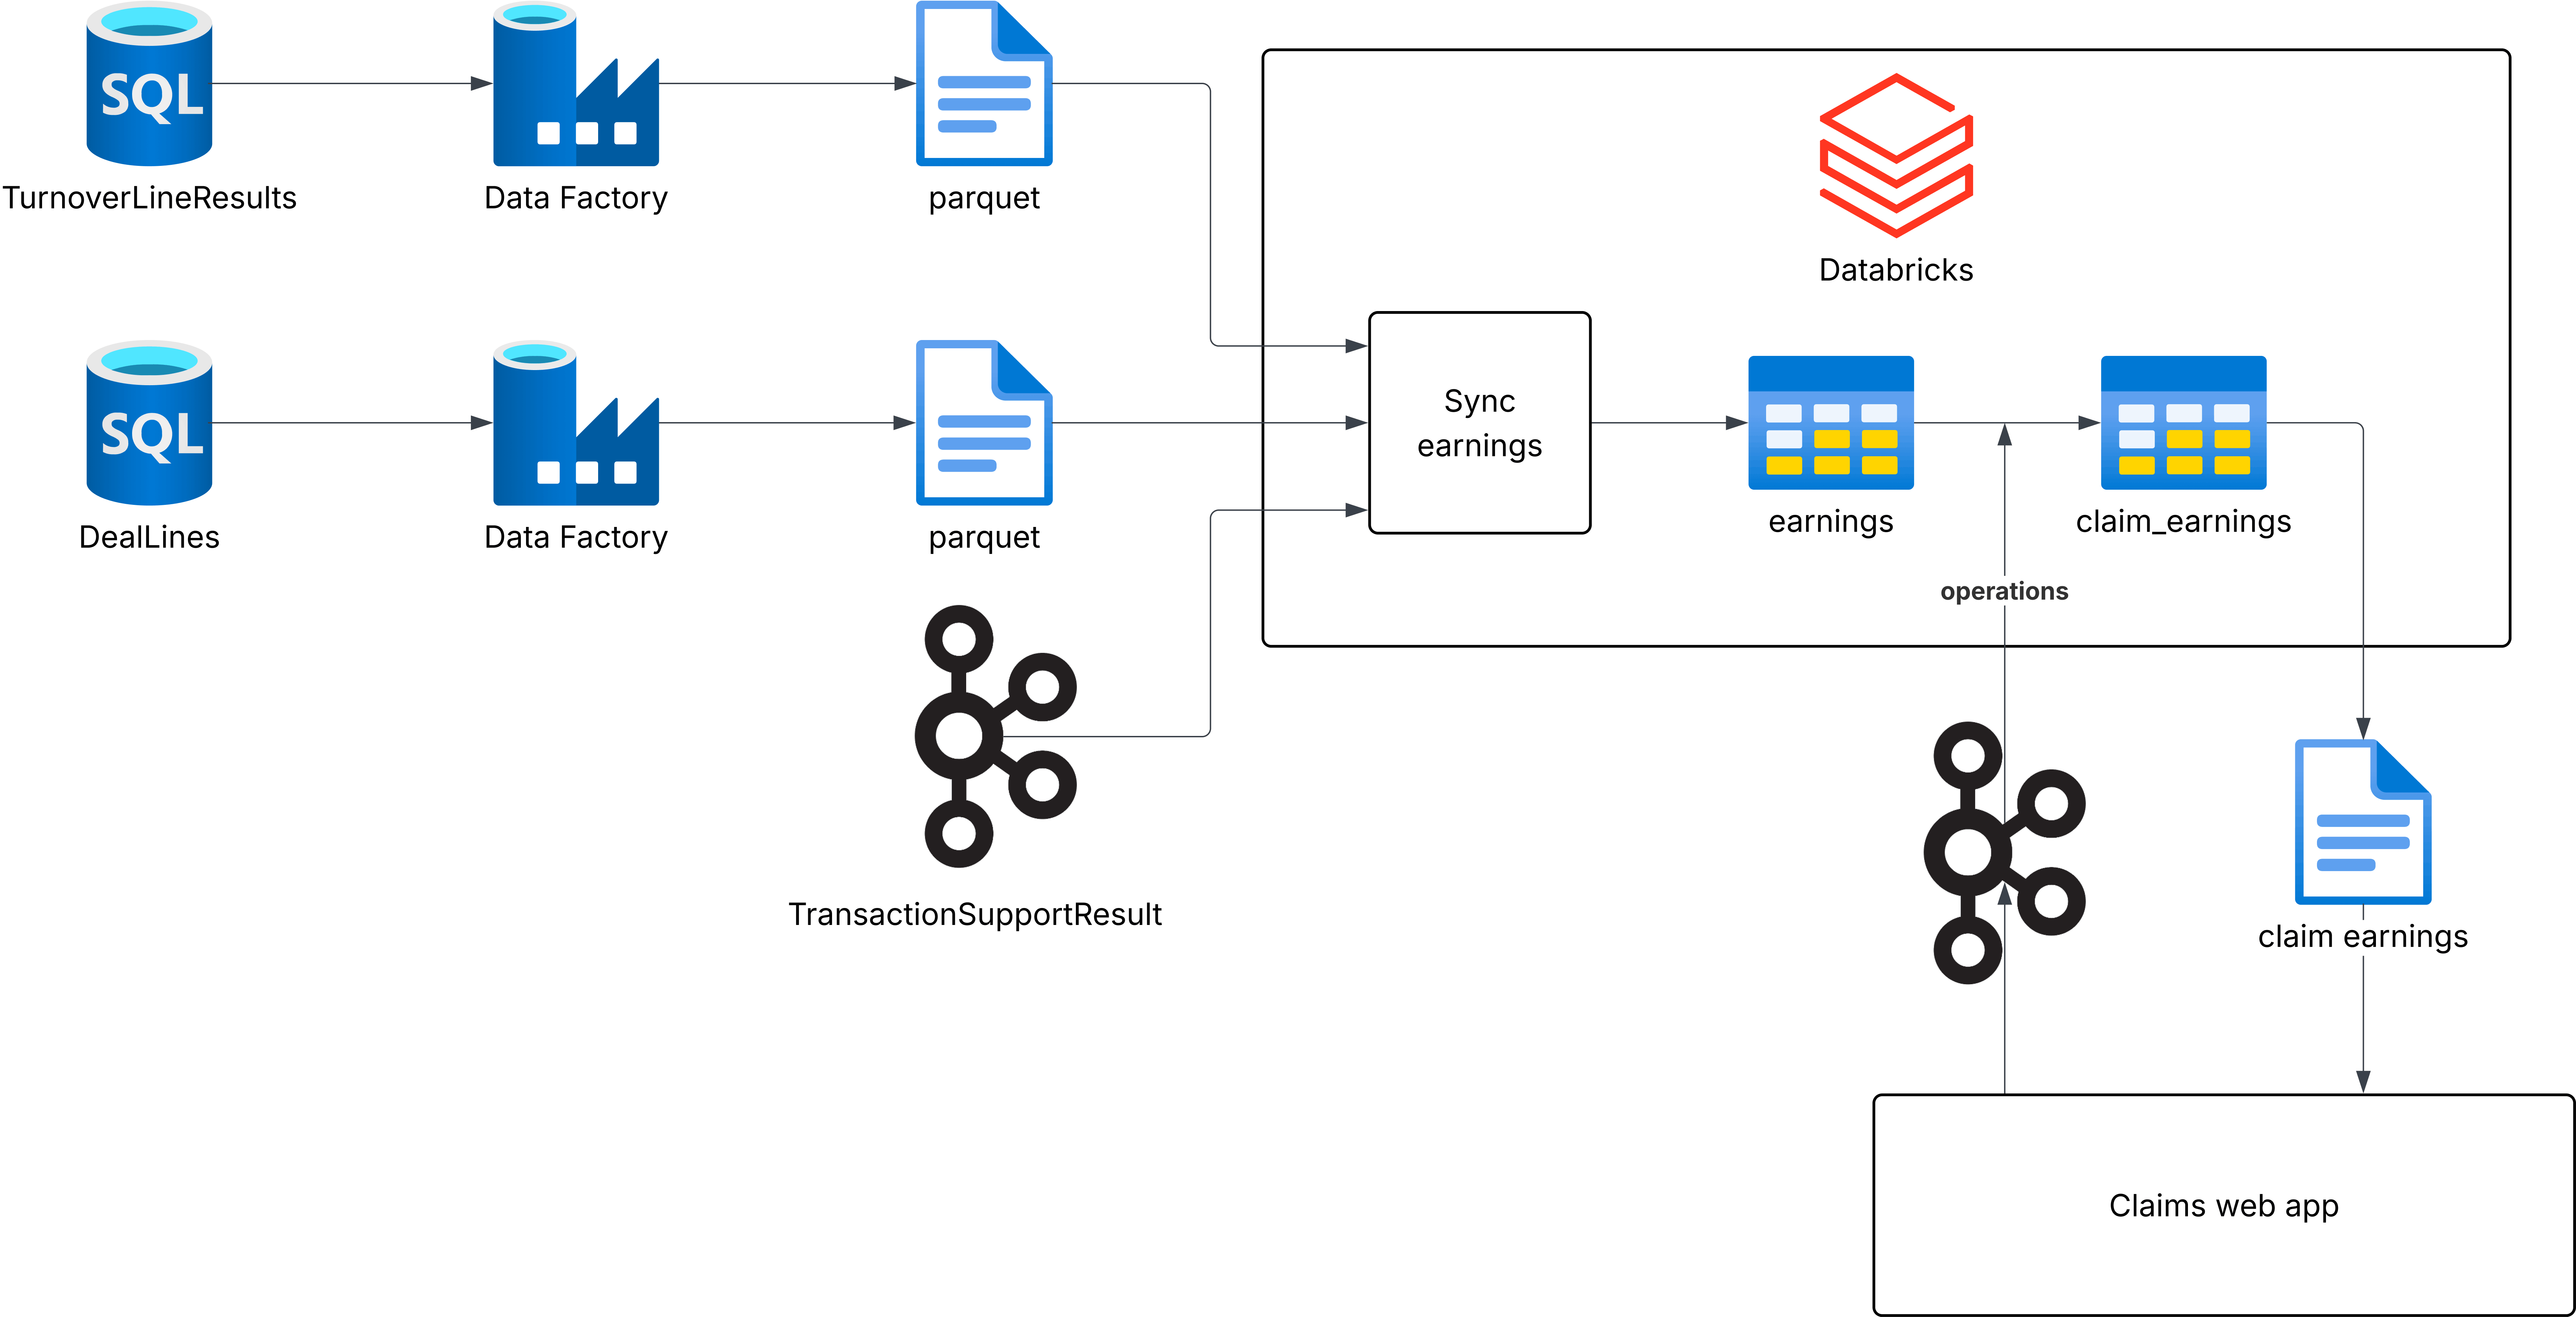
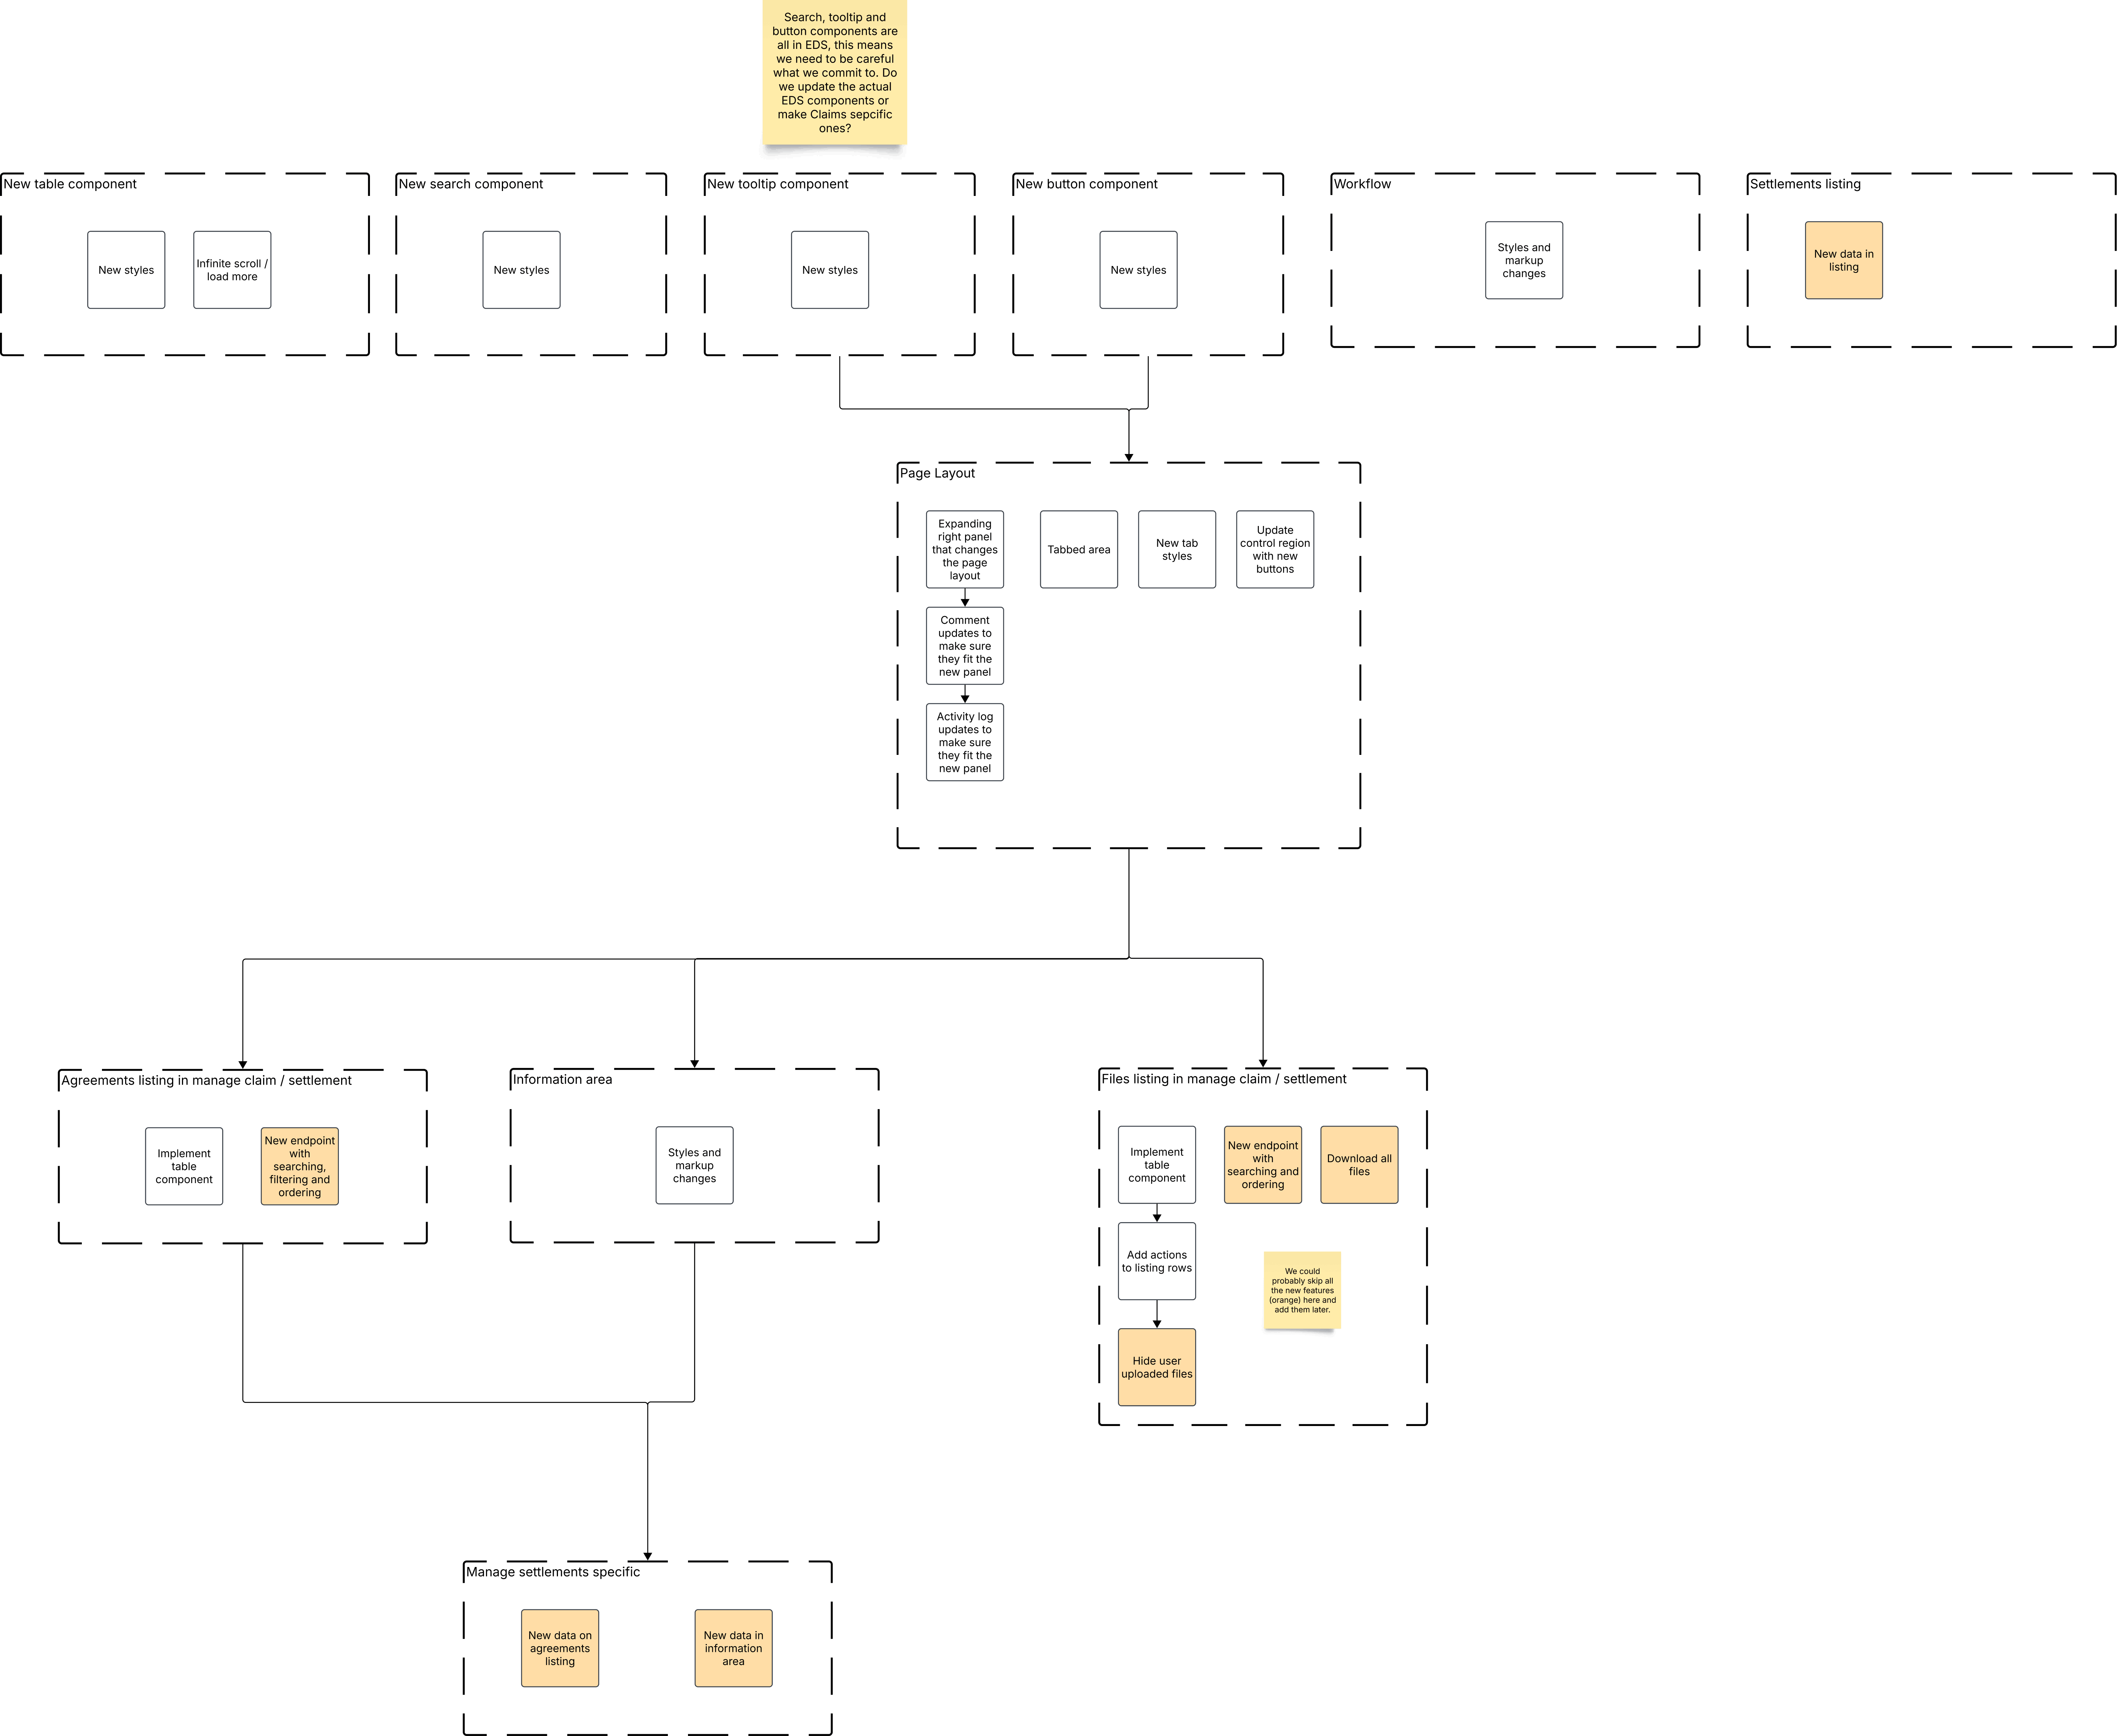
Sat in on engineering workshops mapping the full data pipeline: source systems → Databricks → Claims web app. Understanding the constraints shaped which design directions were actually feasible.

05 · Technical Depth

Design and data model had to move together

Before
AGREEMENT
✕ No data link between Claims and Agreements
CLAIM

Splitting, reversal, and history tracking were impossible before any UI work began.

Joint rearchitecture
Jan – Mar 2025
After
AGREEMENT
Splitting Traceability Linked Claims Reversal
CLAIM

Every feature on the 2025 roadmap became buildable.

06 · Features · Apr – Dec 2025

10+ features shipped in 9 months

Q1 · Foundation Launch

Claim detail page redesign + rearchitecture (Jan–Mar). Design system adoption. Shared component library shipped (Apr–May).

Q2 · Splitting + Listing Redesign

Claim Splitting (3 phases) · Listing redesign + bulk actions · Unique IDs · Claim Reversal · Recalculation

Q3 · Payments

Payments Workflow: full receive-and-allocate lifecycle for payment-segment customers.

Q4 · Templates + PDF + Linked Claims

File Templates · Claim Summary PDF · Linked Claims (engineer-suggested, 2-day hackathon)

06 · Feature Spotlight · #1 Customer Request

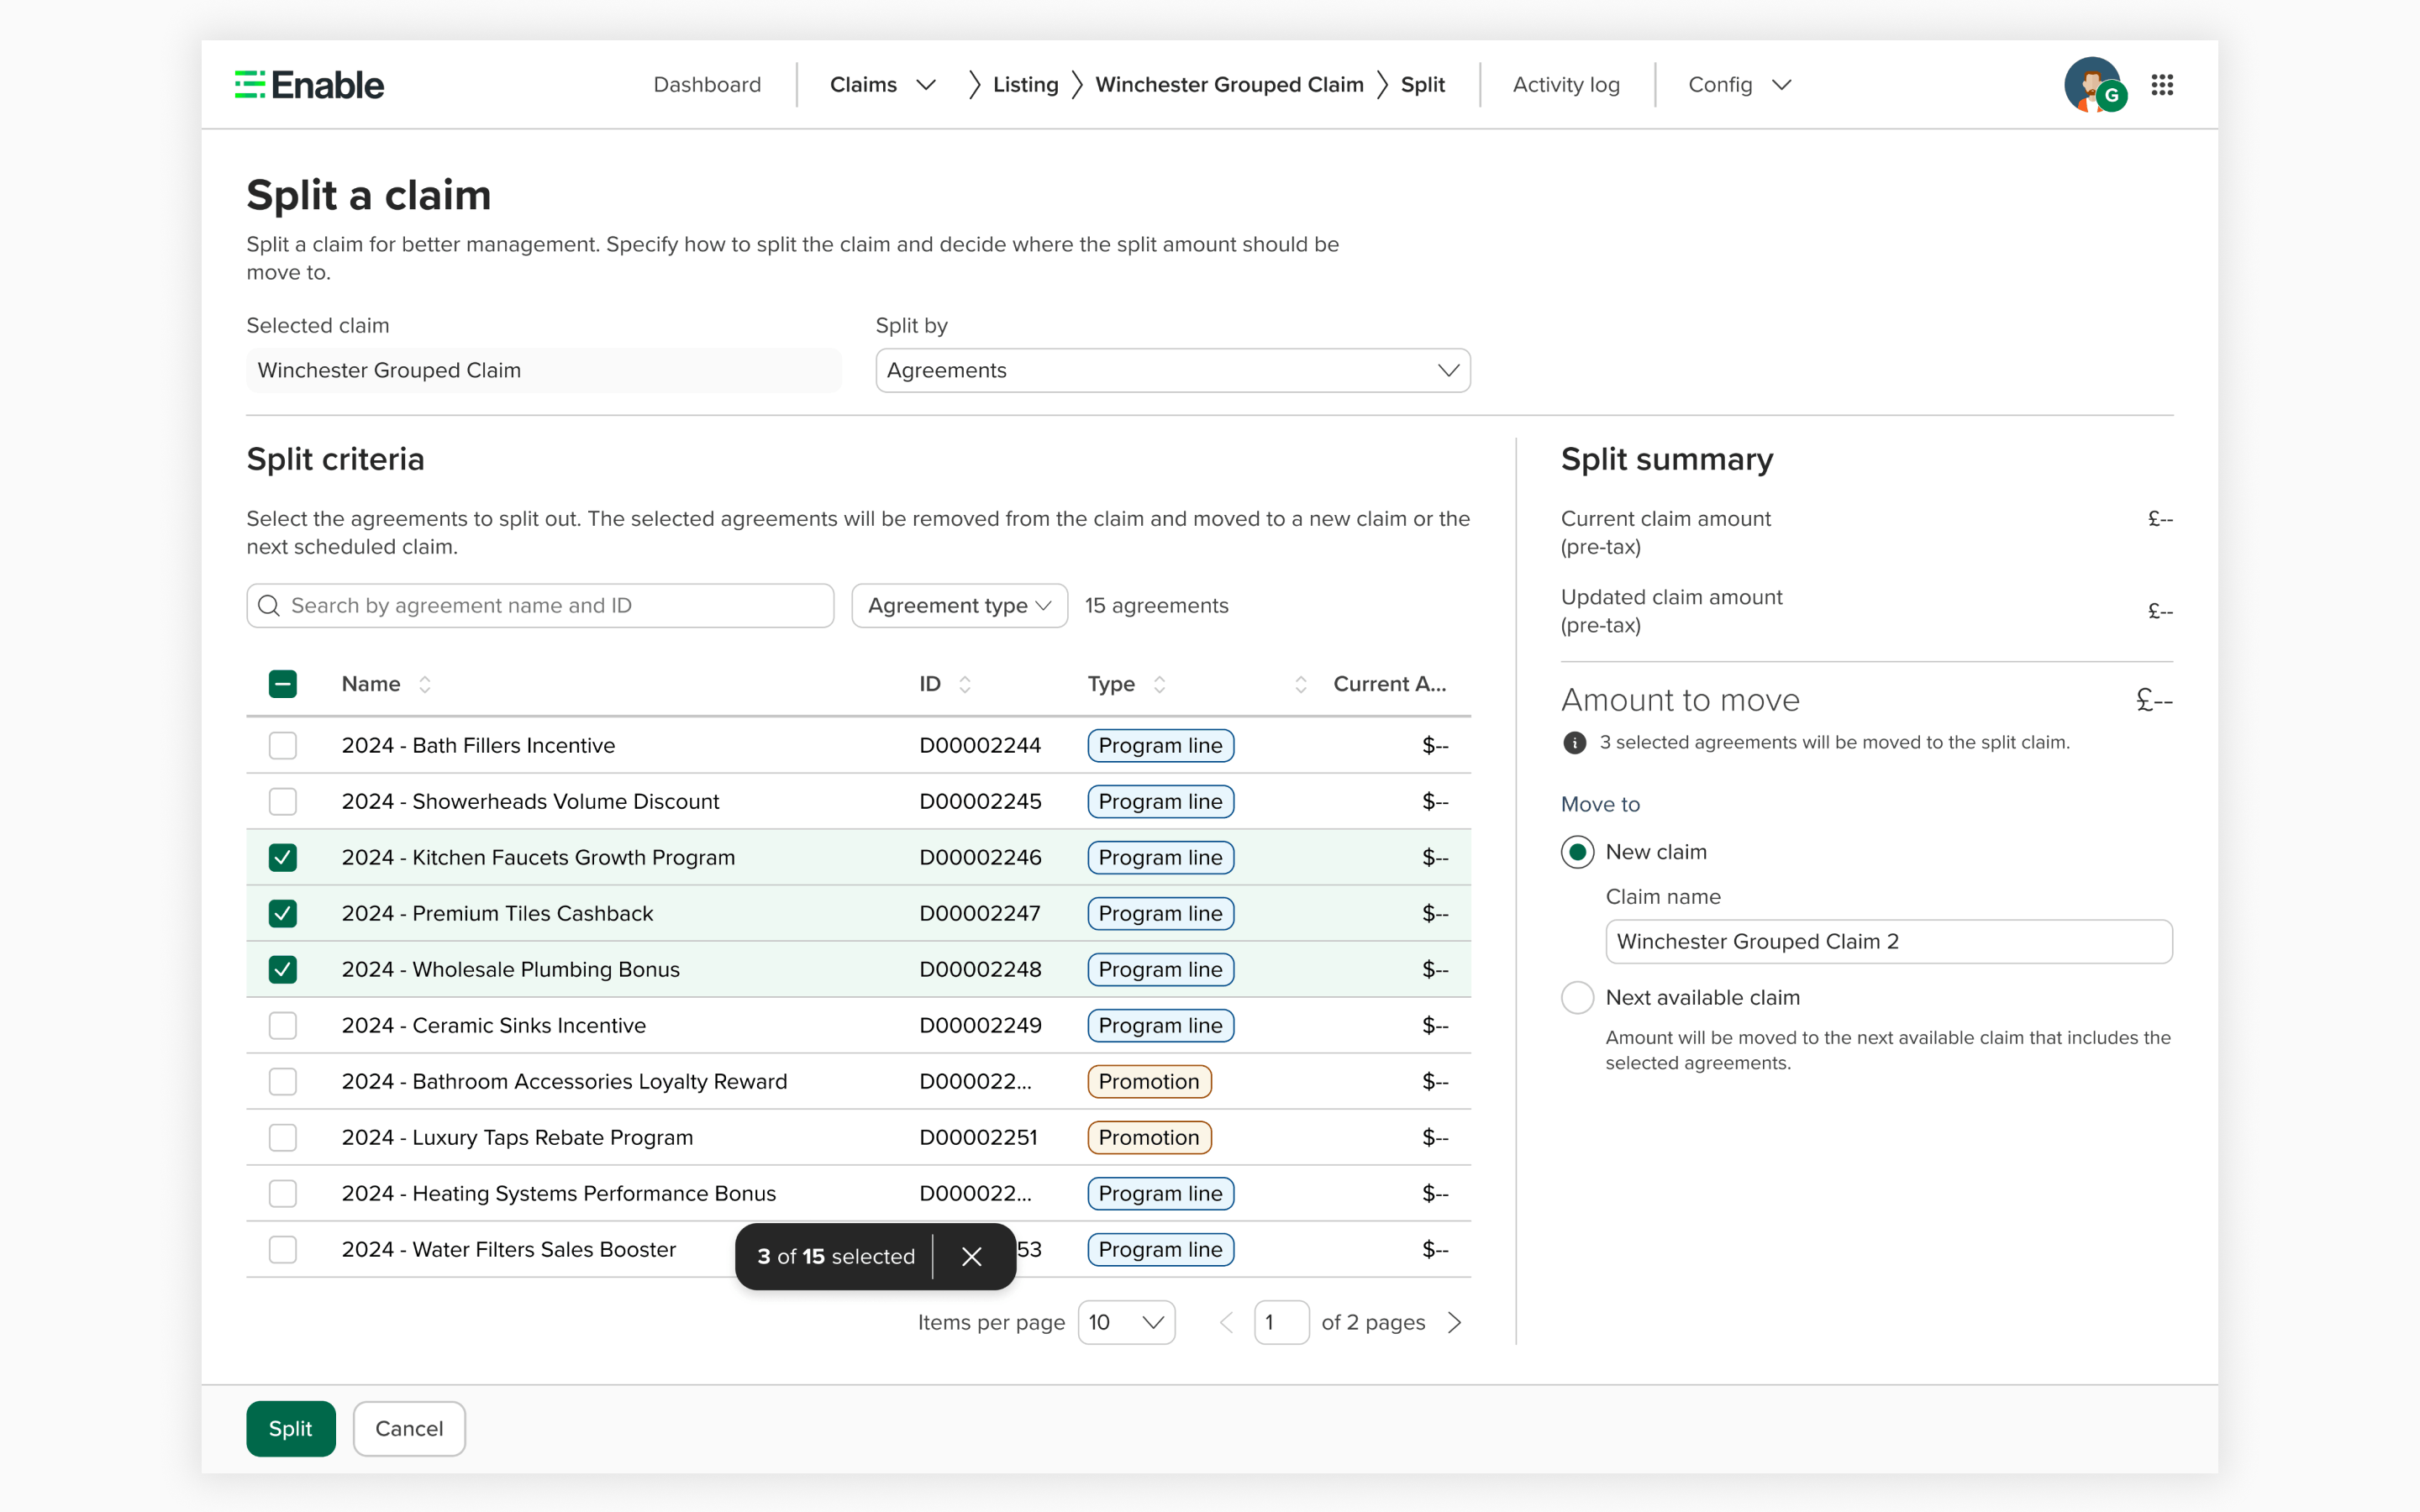
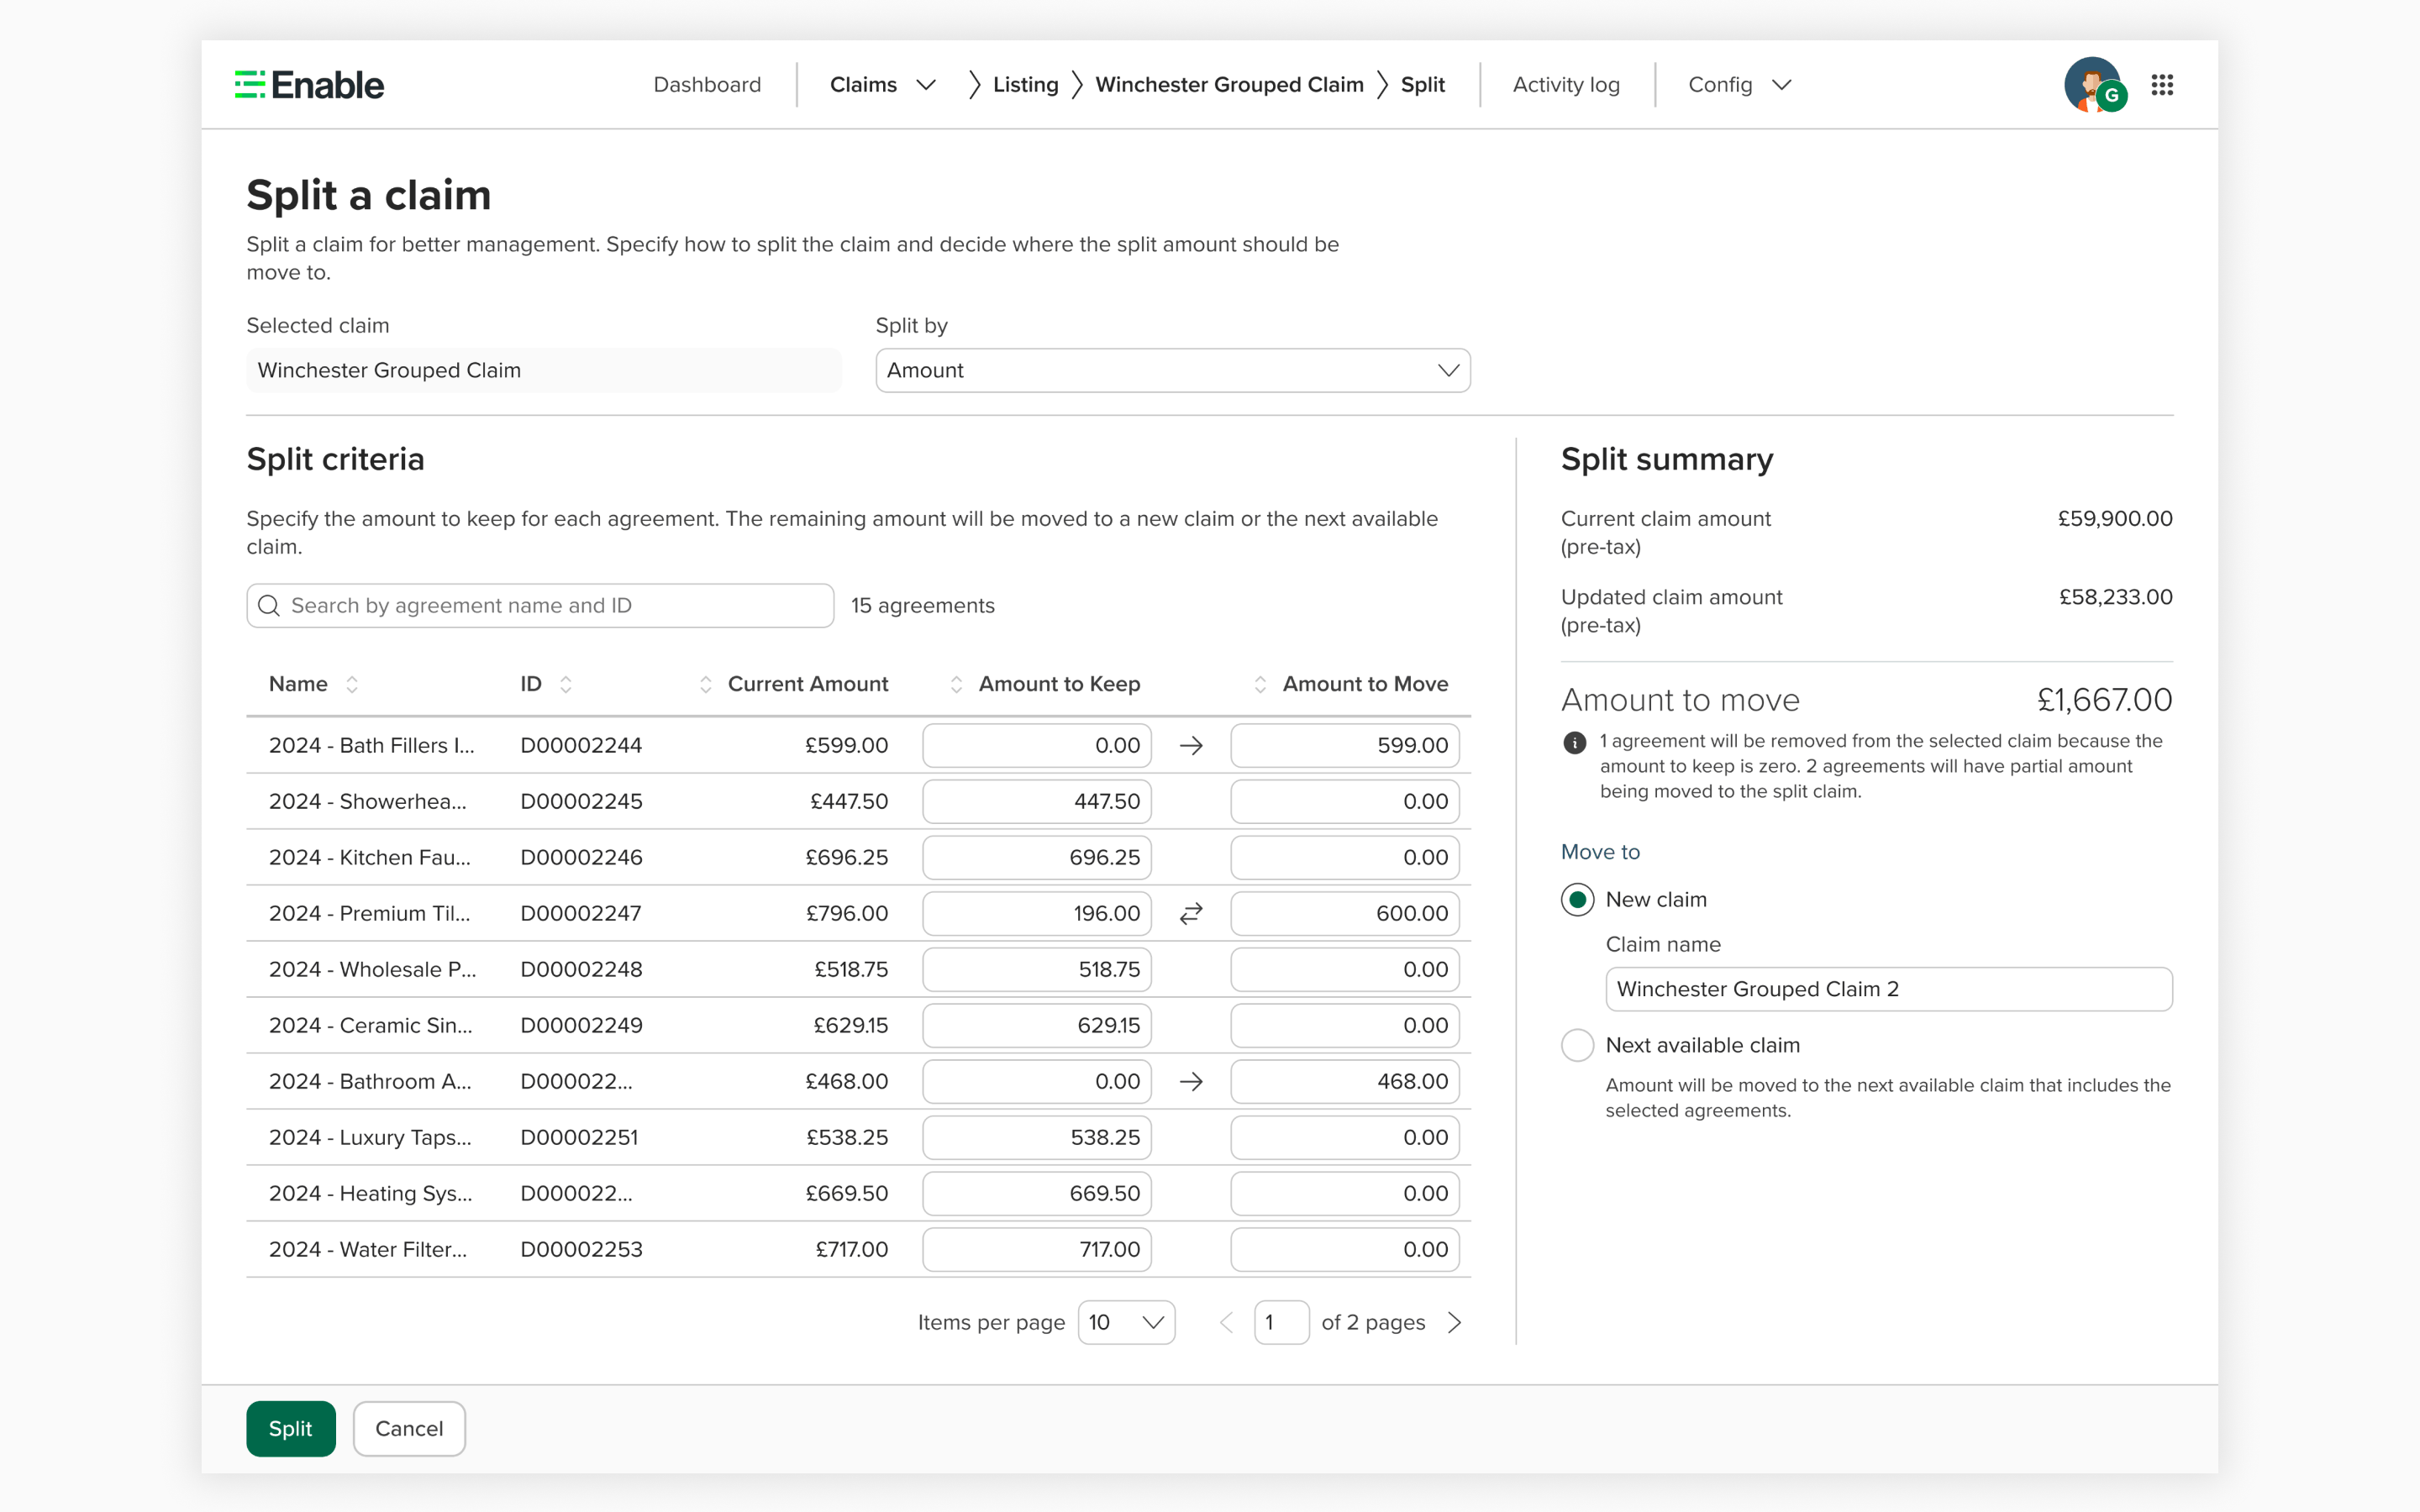
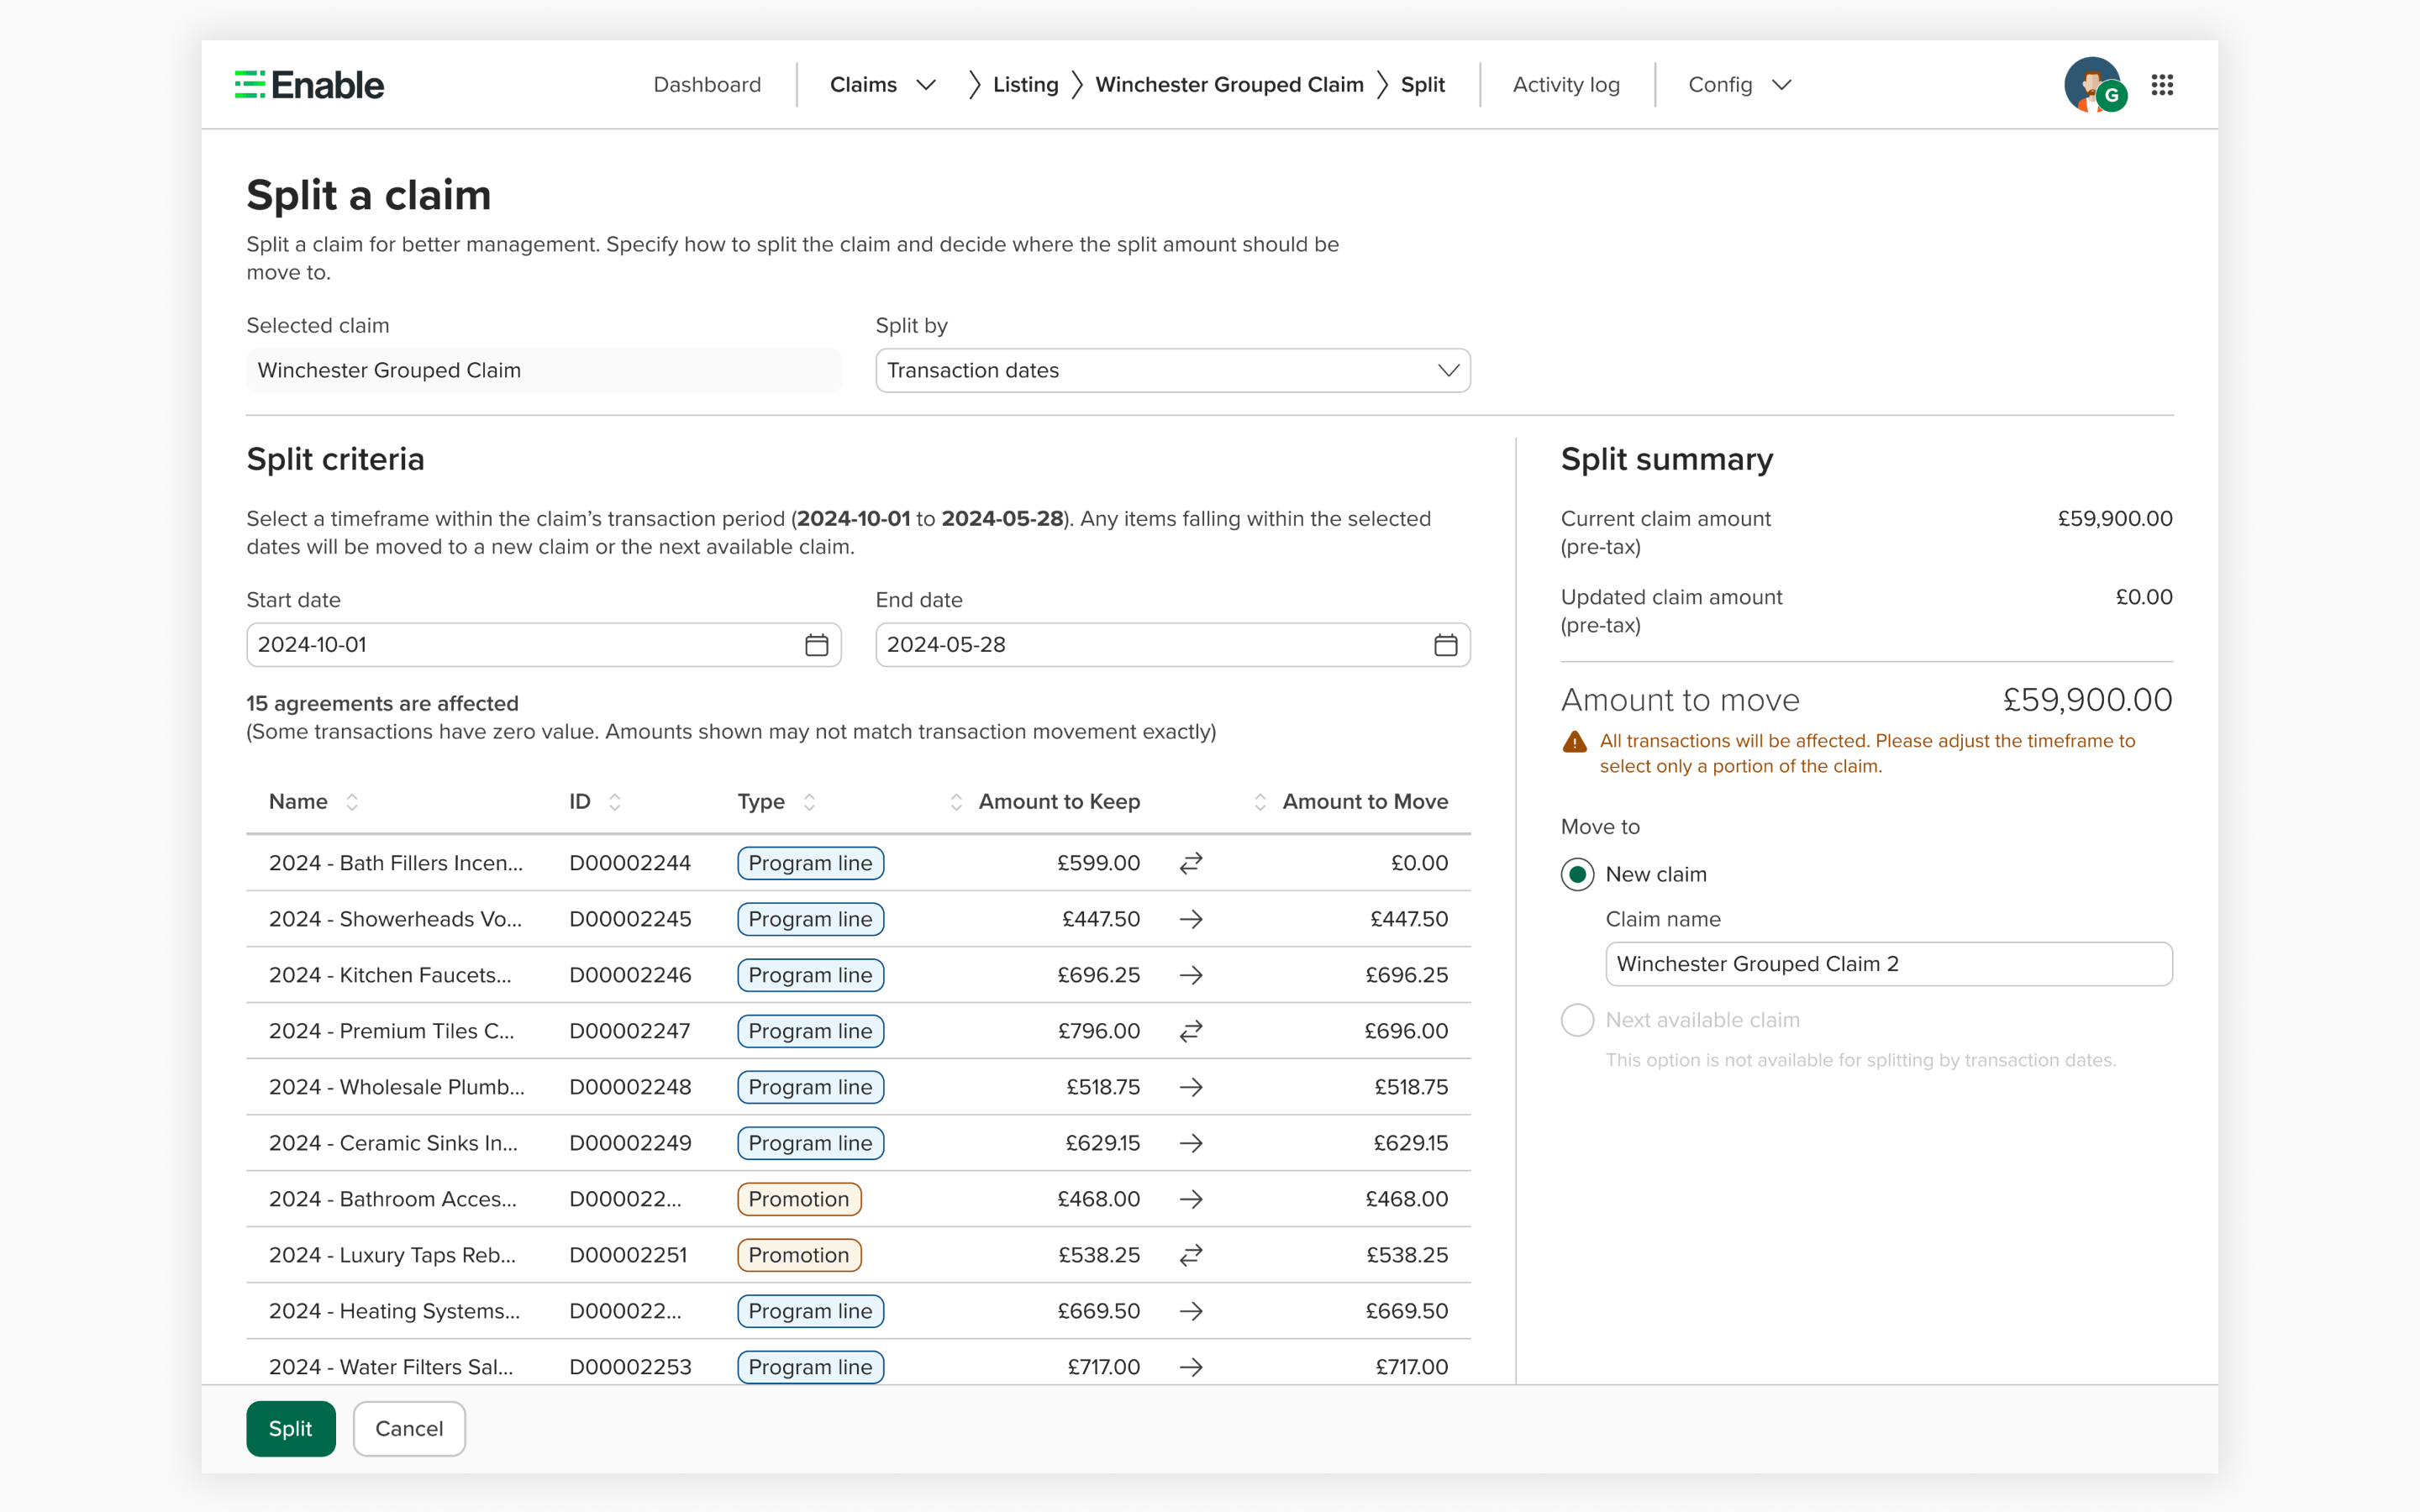
Claim Splitting

The #1 customer request.
Shipped in three phases — customers got value at each step.

1
Split by Agreement
Move individual agreements to a new or existing claim
2
Split by Amount
Adjust specific amounts on agreements when claiming a partial
3
Split by Transaction Date
Split by date — critical for ERP reconciliation

"Splitting changed everything for us. We were doing this manually in spreadsheets before."

— Enterprise customer, post-splitting launch
06 · Features · Q3 2025

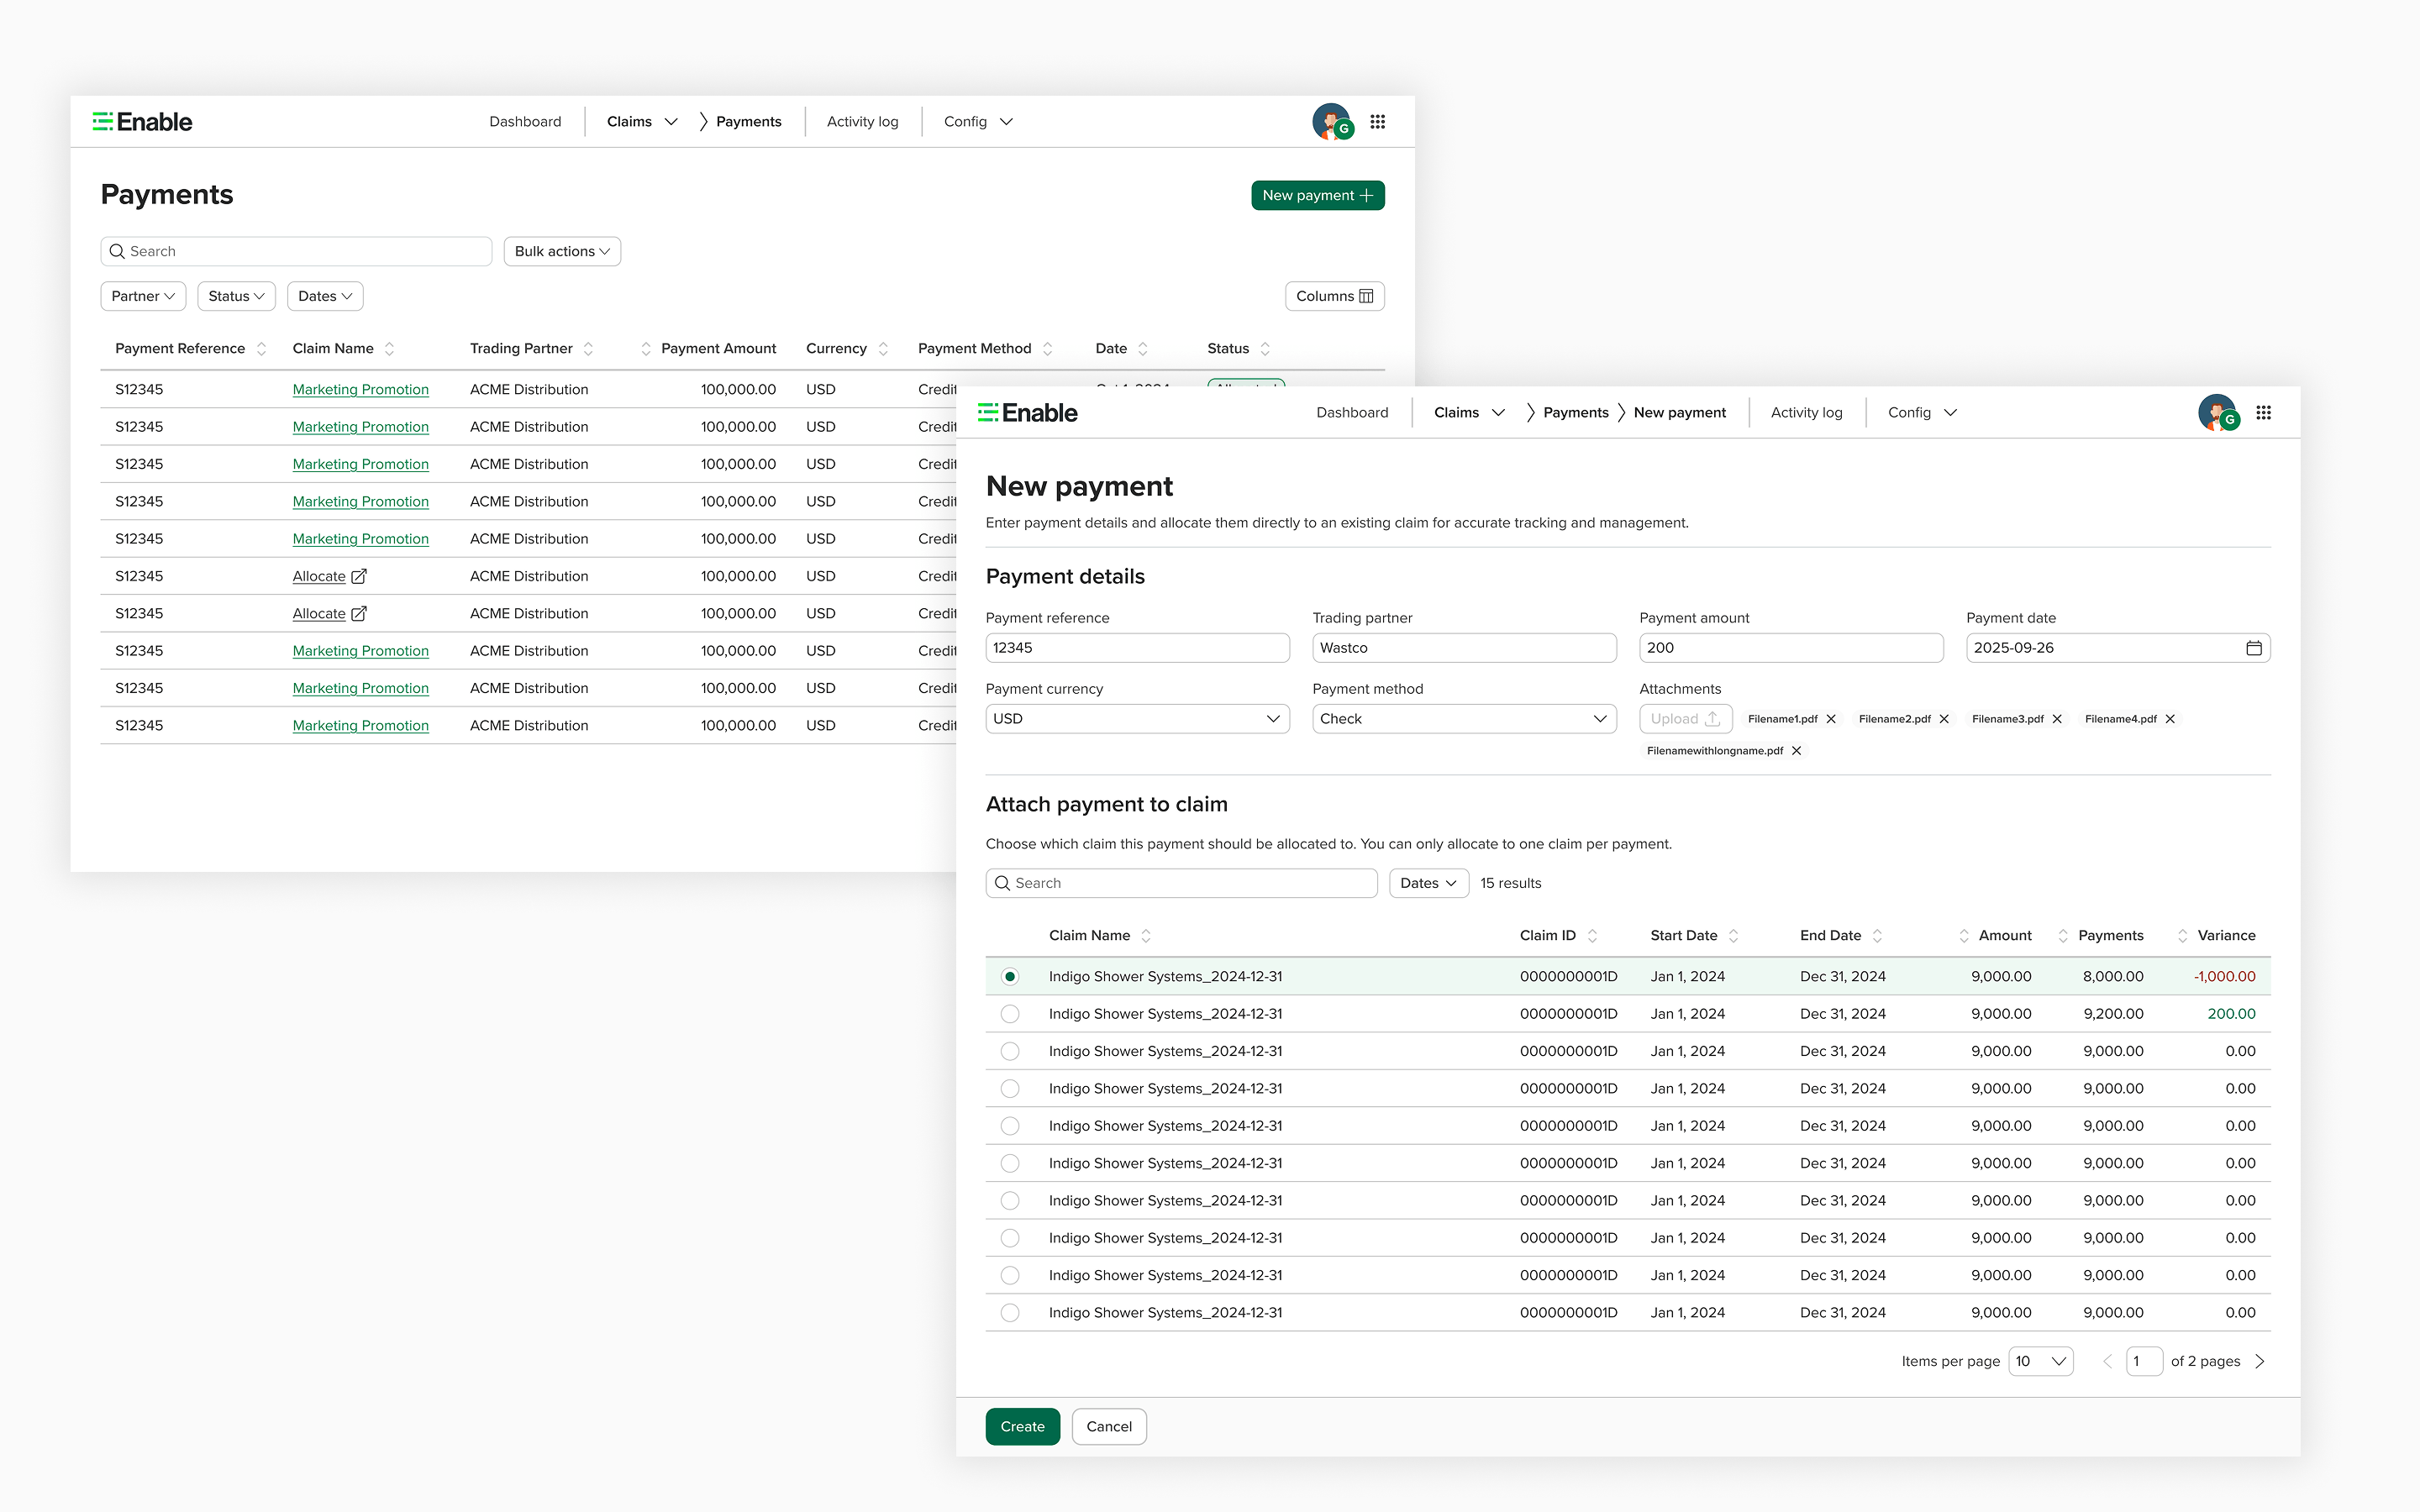
Payments Workflow

Payments workflow
Payment Segment Users

Watsco, BKBG, Solotech receive and allocate payments entirely within Enable. No ERP posting.

Receive

Log incoming payment against the open claim.

Allocate

Distribute across agreements. Partial payments supported.

Settle

Mark as settled when allocation is verified.

07 · Edge Case Coverage

Designing the unhappy paths

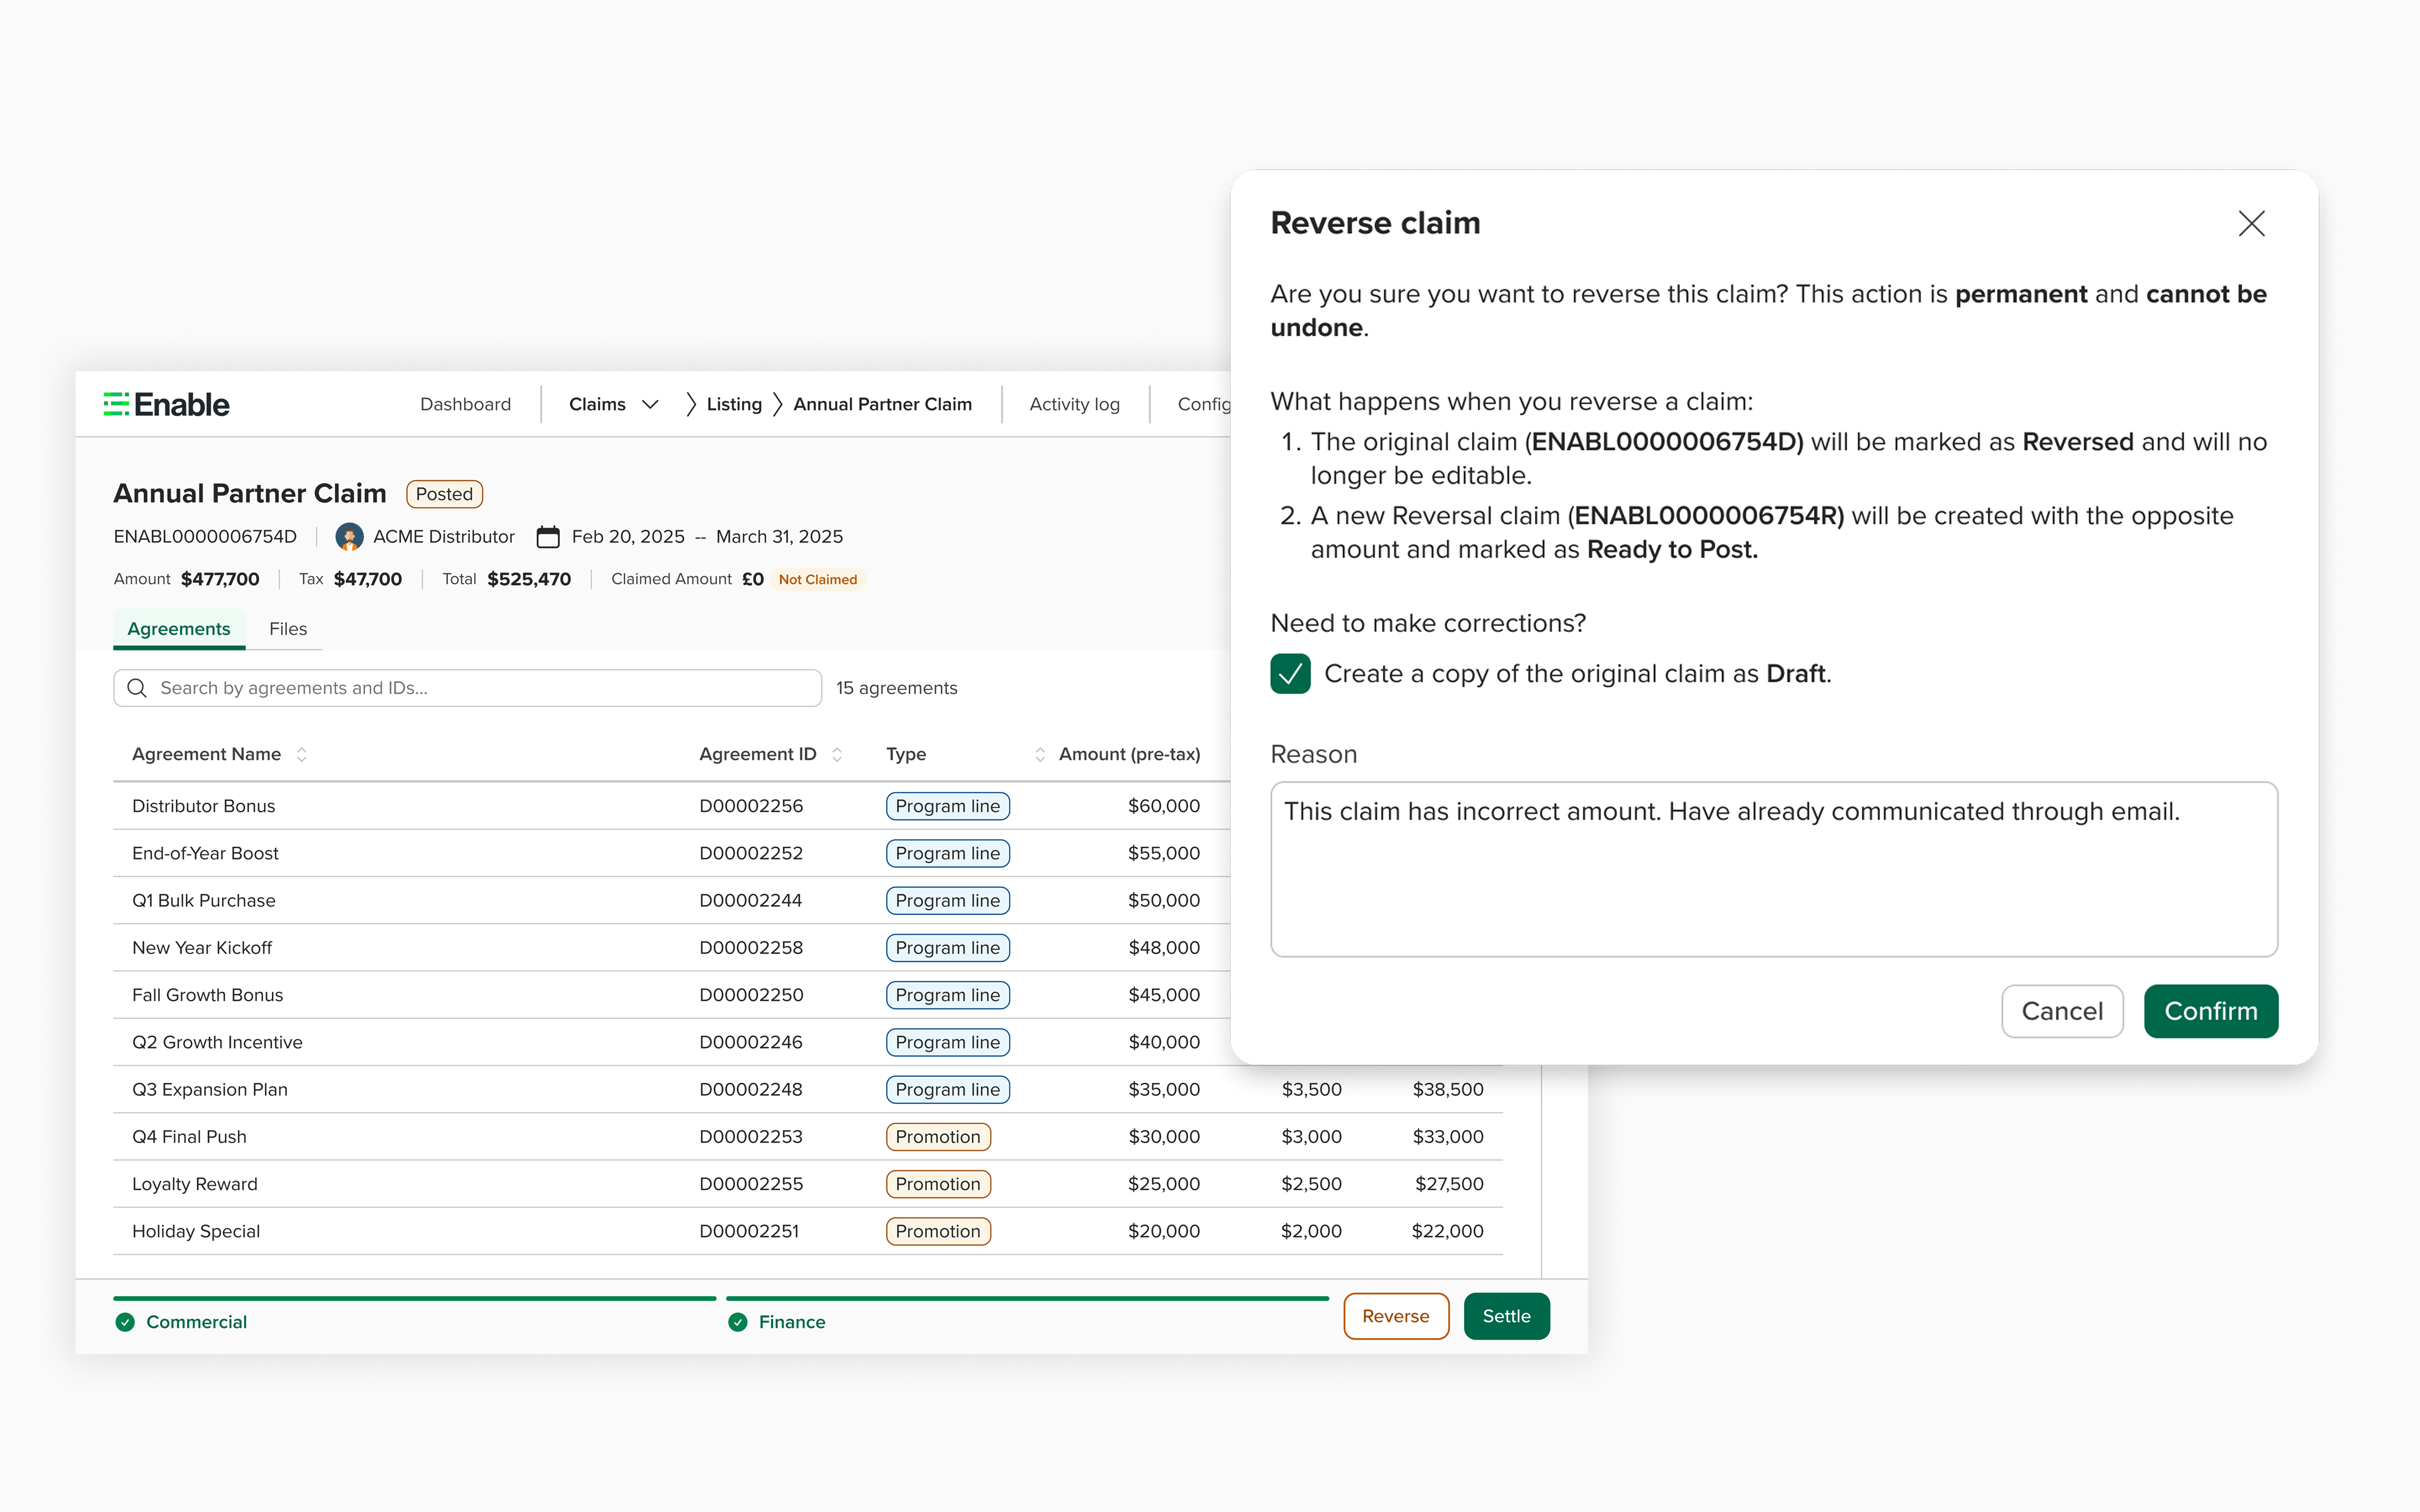
Claim Reversal
Claim reversal — linked negative claim view
A posted claim is a financial record. No delete allowed. Reversal creates a linked negative claim. Full audit trail preserved.
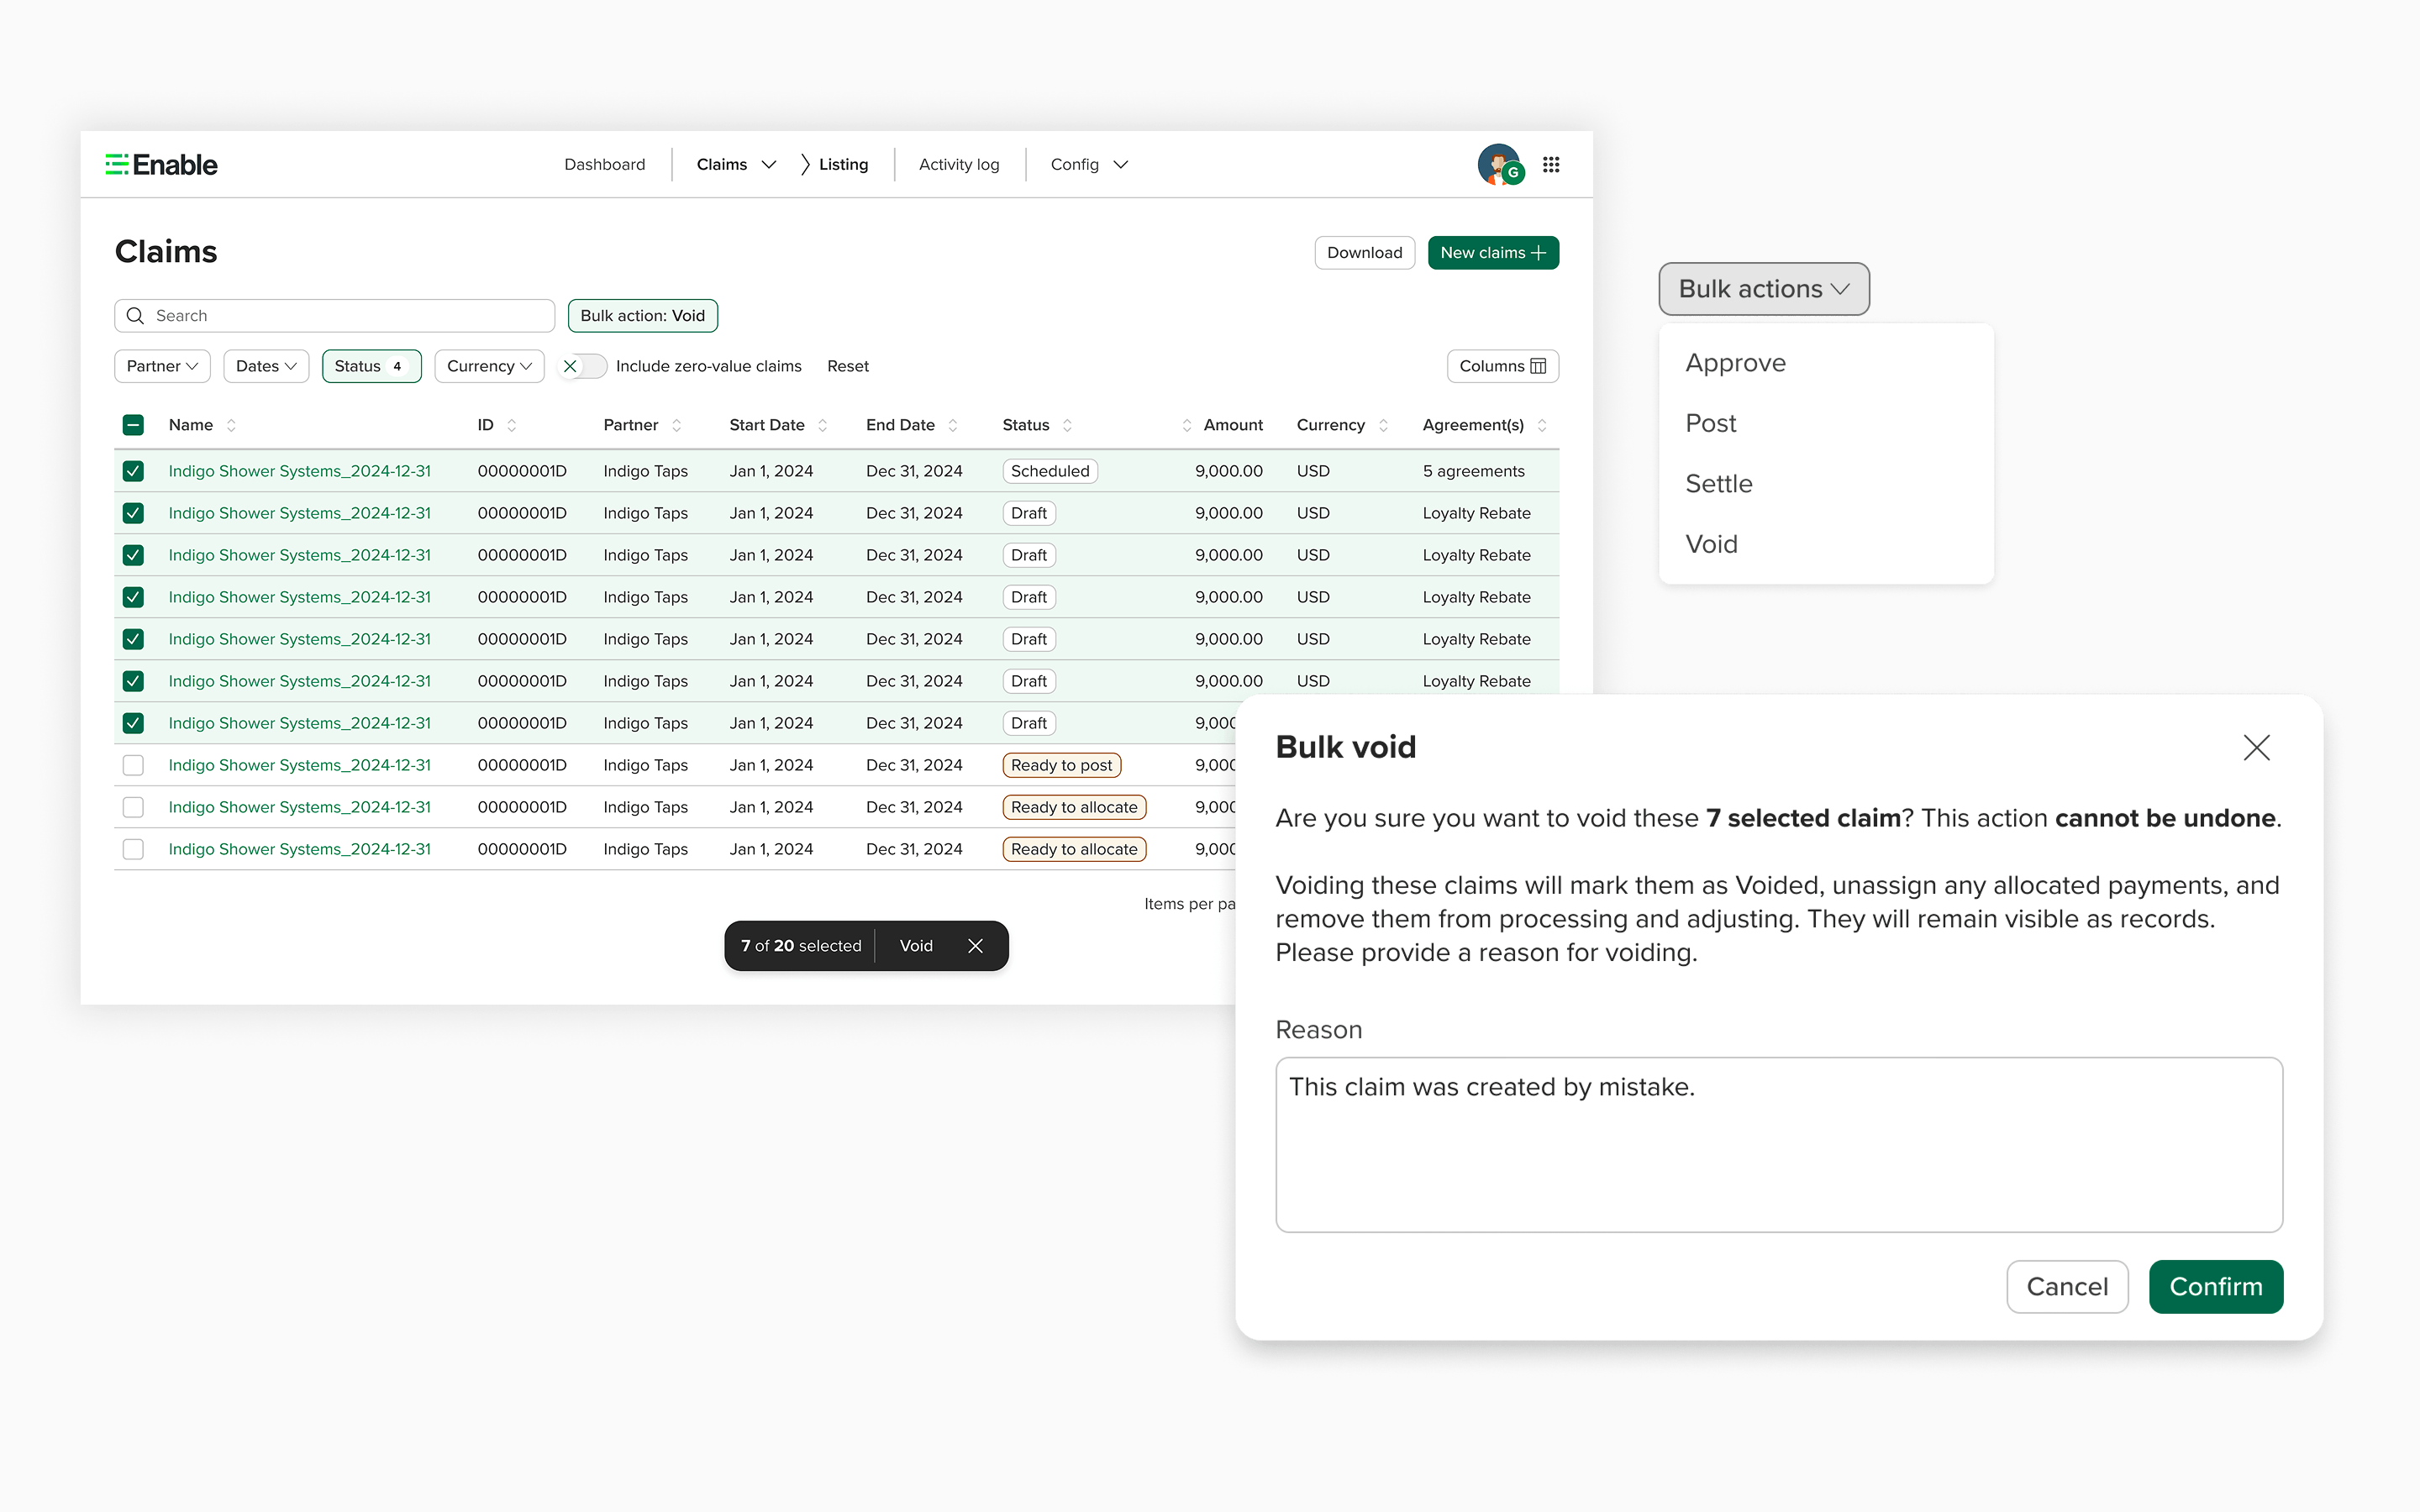
Bulk Void
Bulk void — clean up claims without deleting records
Previously: hard delete, no trace. Bulk void retires claims cleanly while keeping the full audit trail.
07 · Edge Case Coverage · cont.

No ambiguous states.

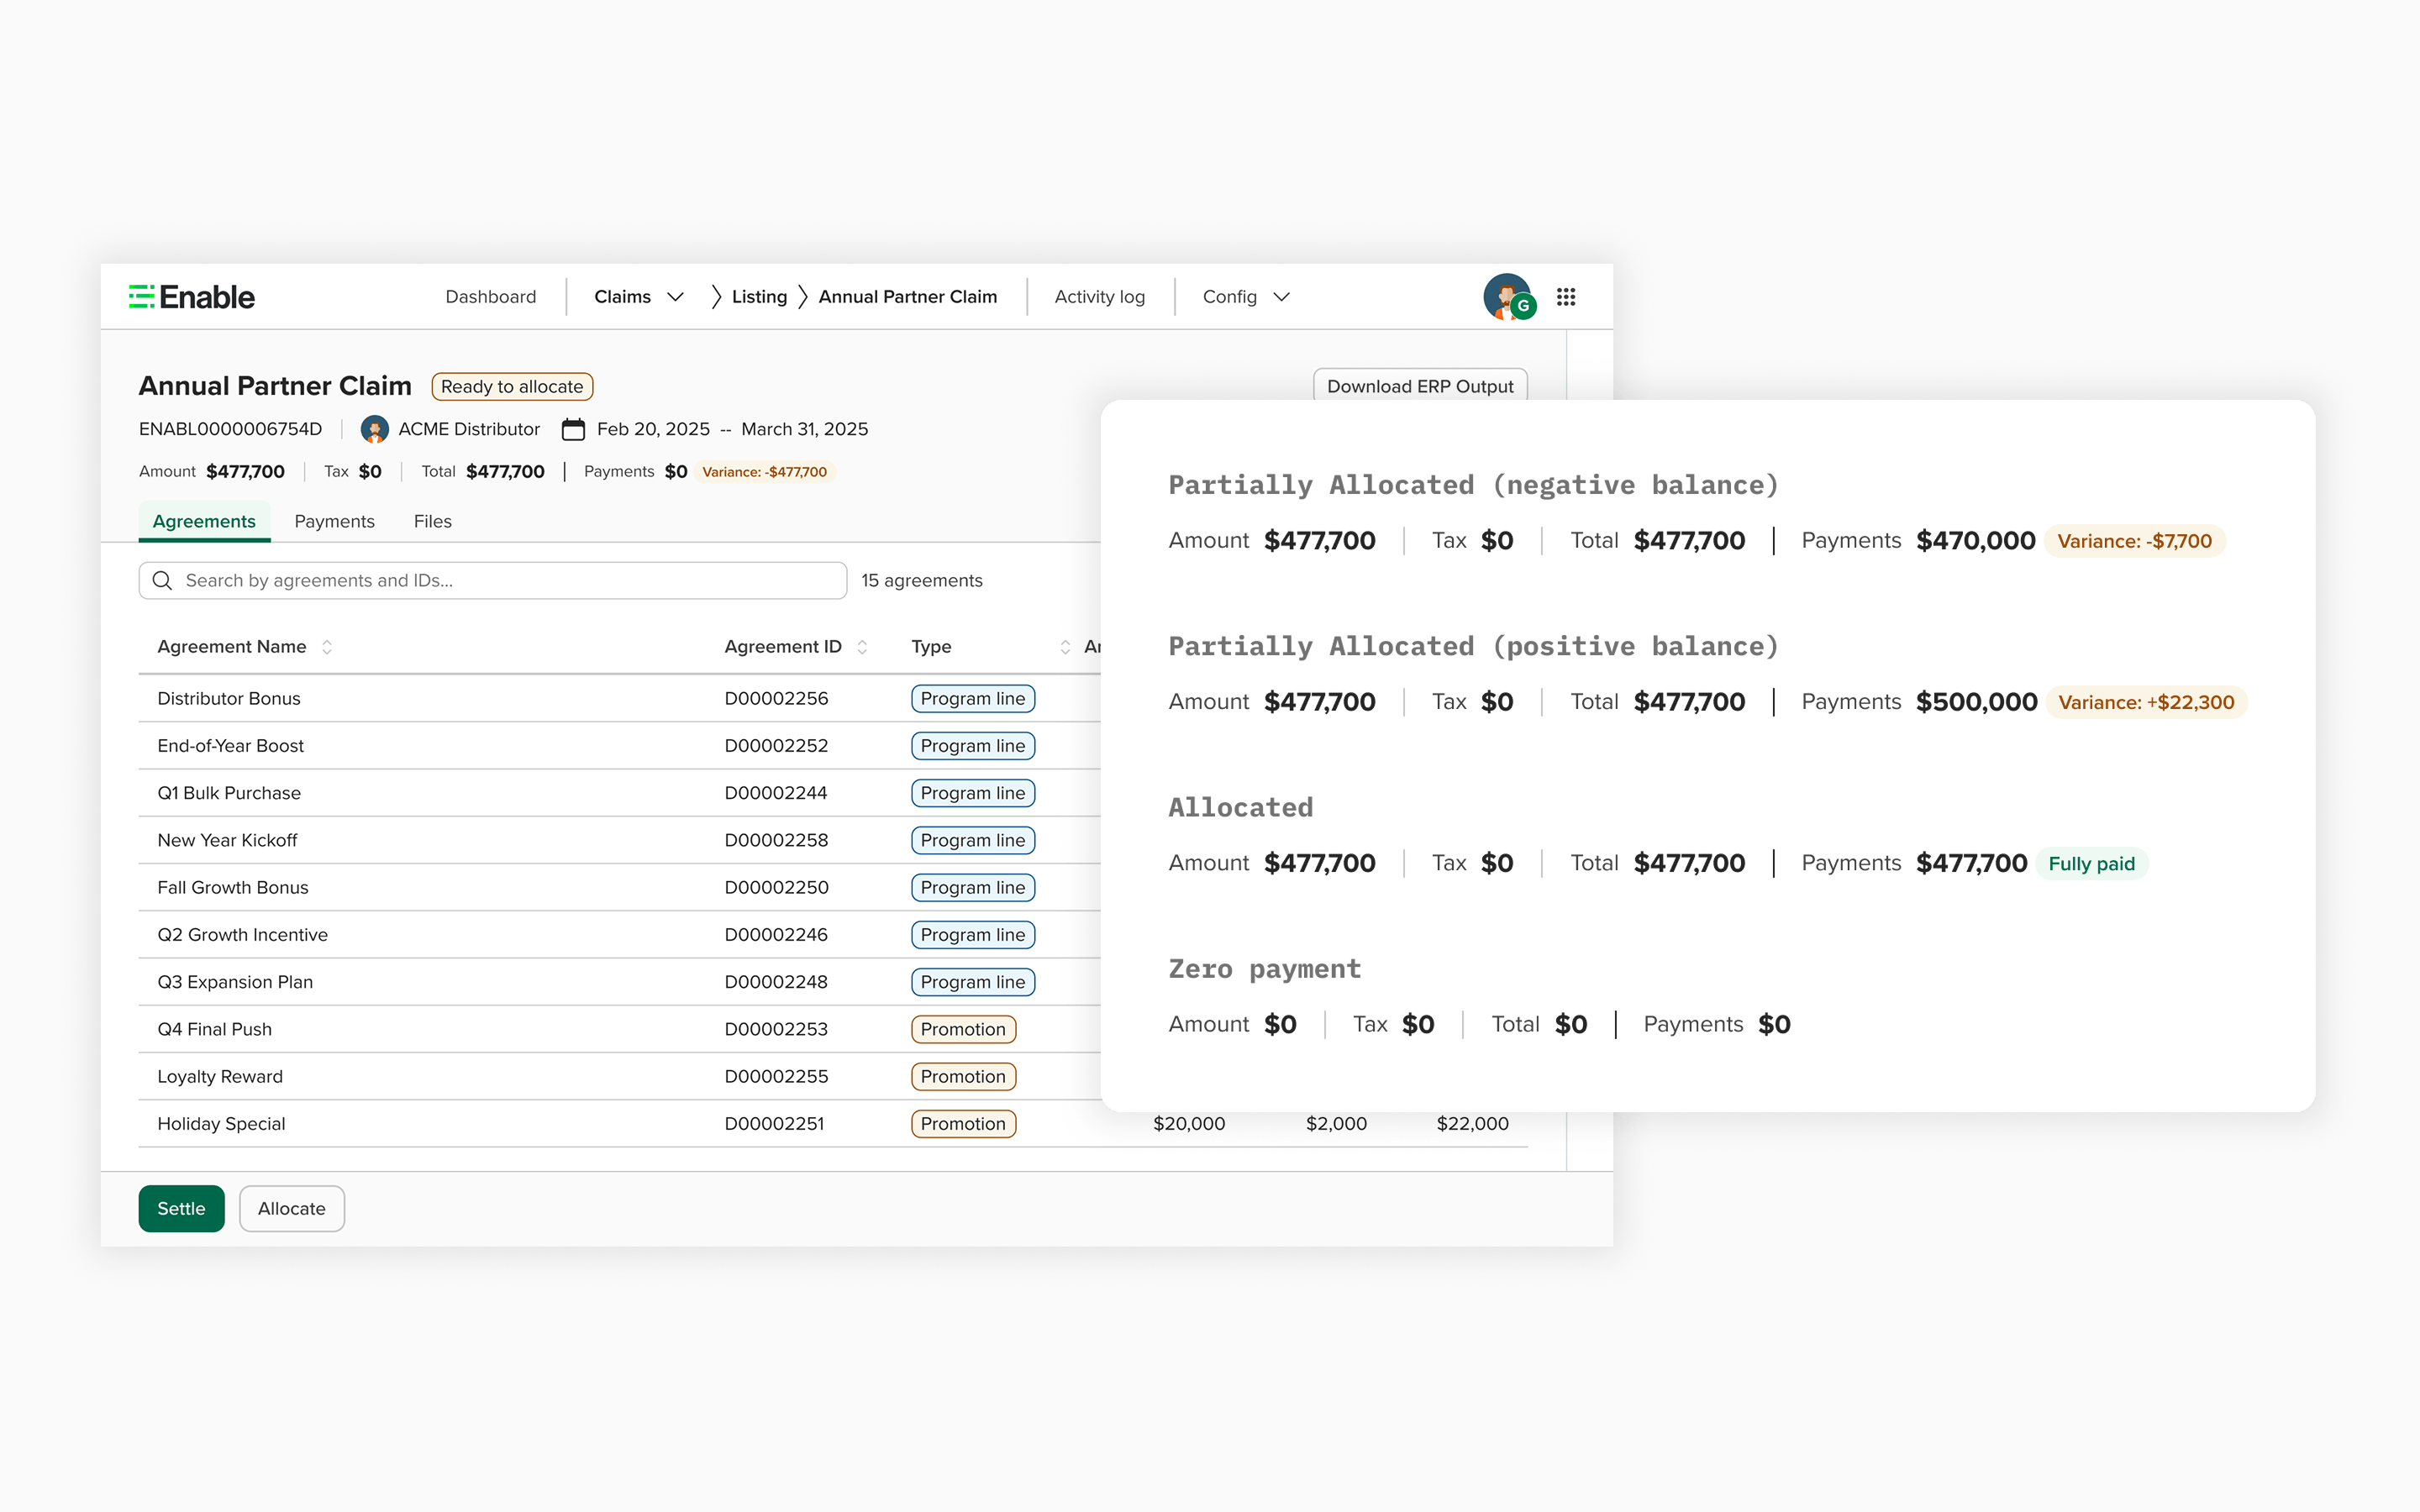
Payment Allocation States
Payment allocation states — over, under, exact match, zero value
Explicit states: over-allocated, under-allocated, exact match, zero value. Each with clear guidance and action options.
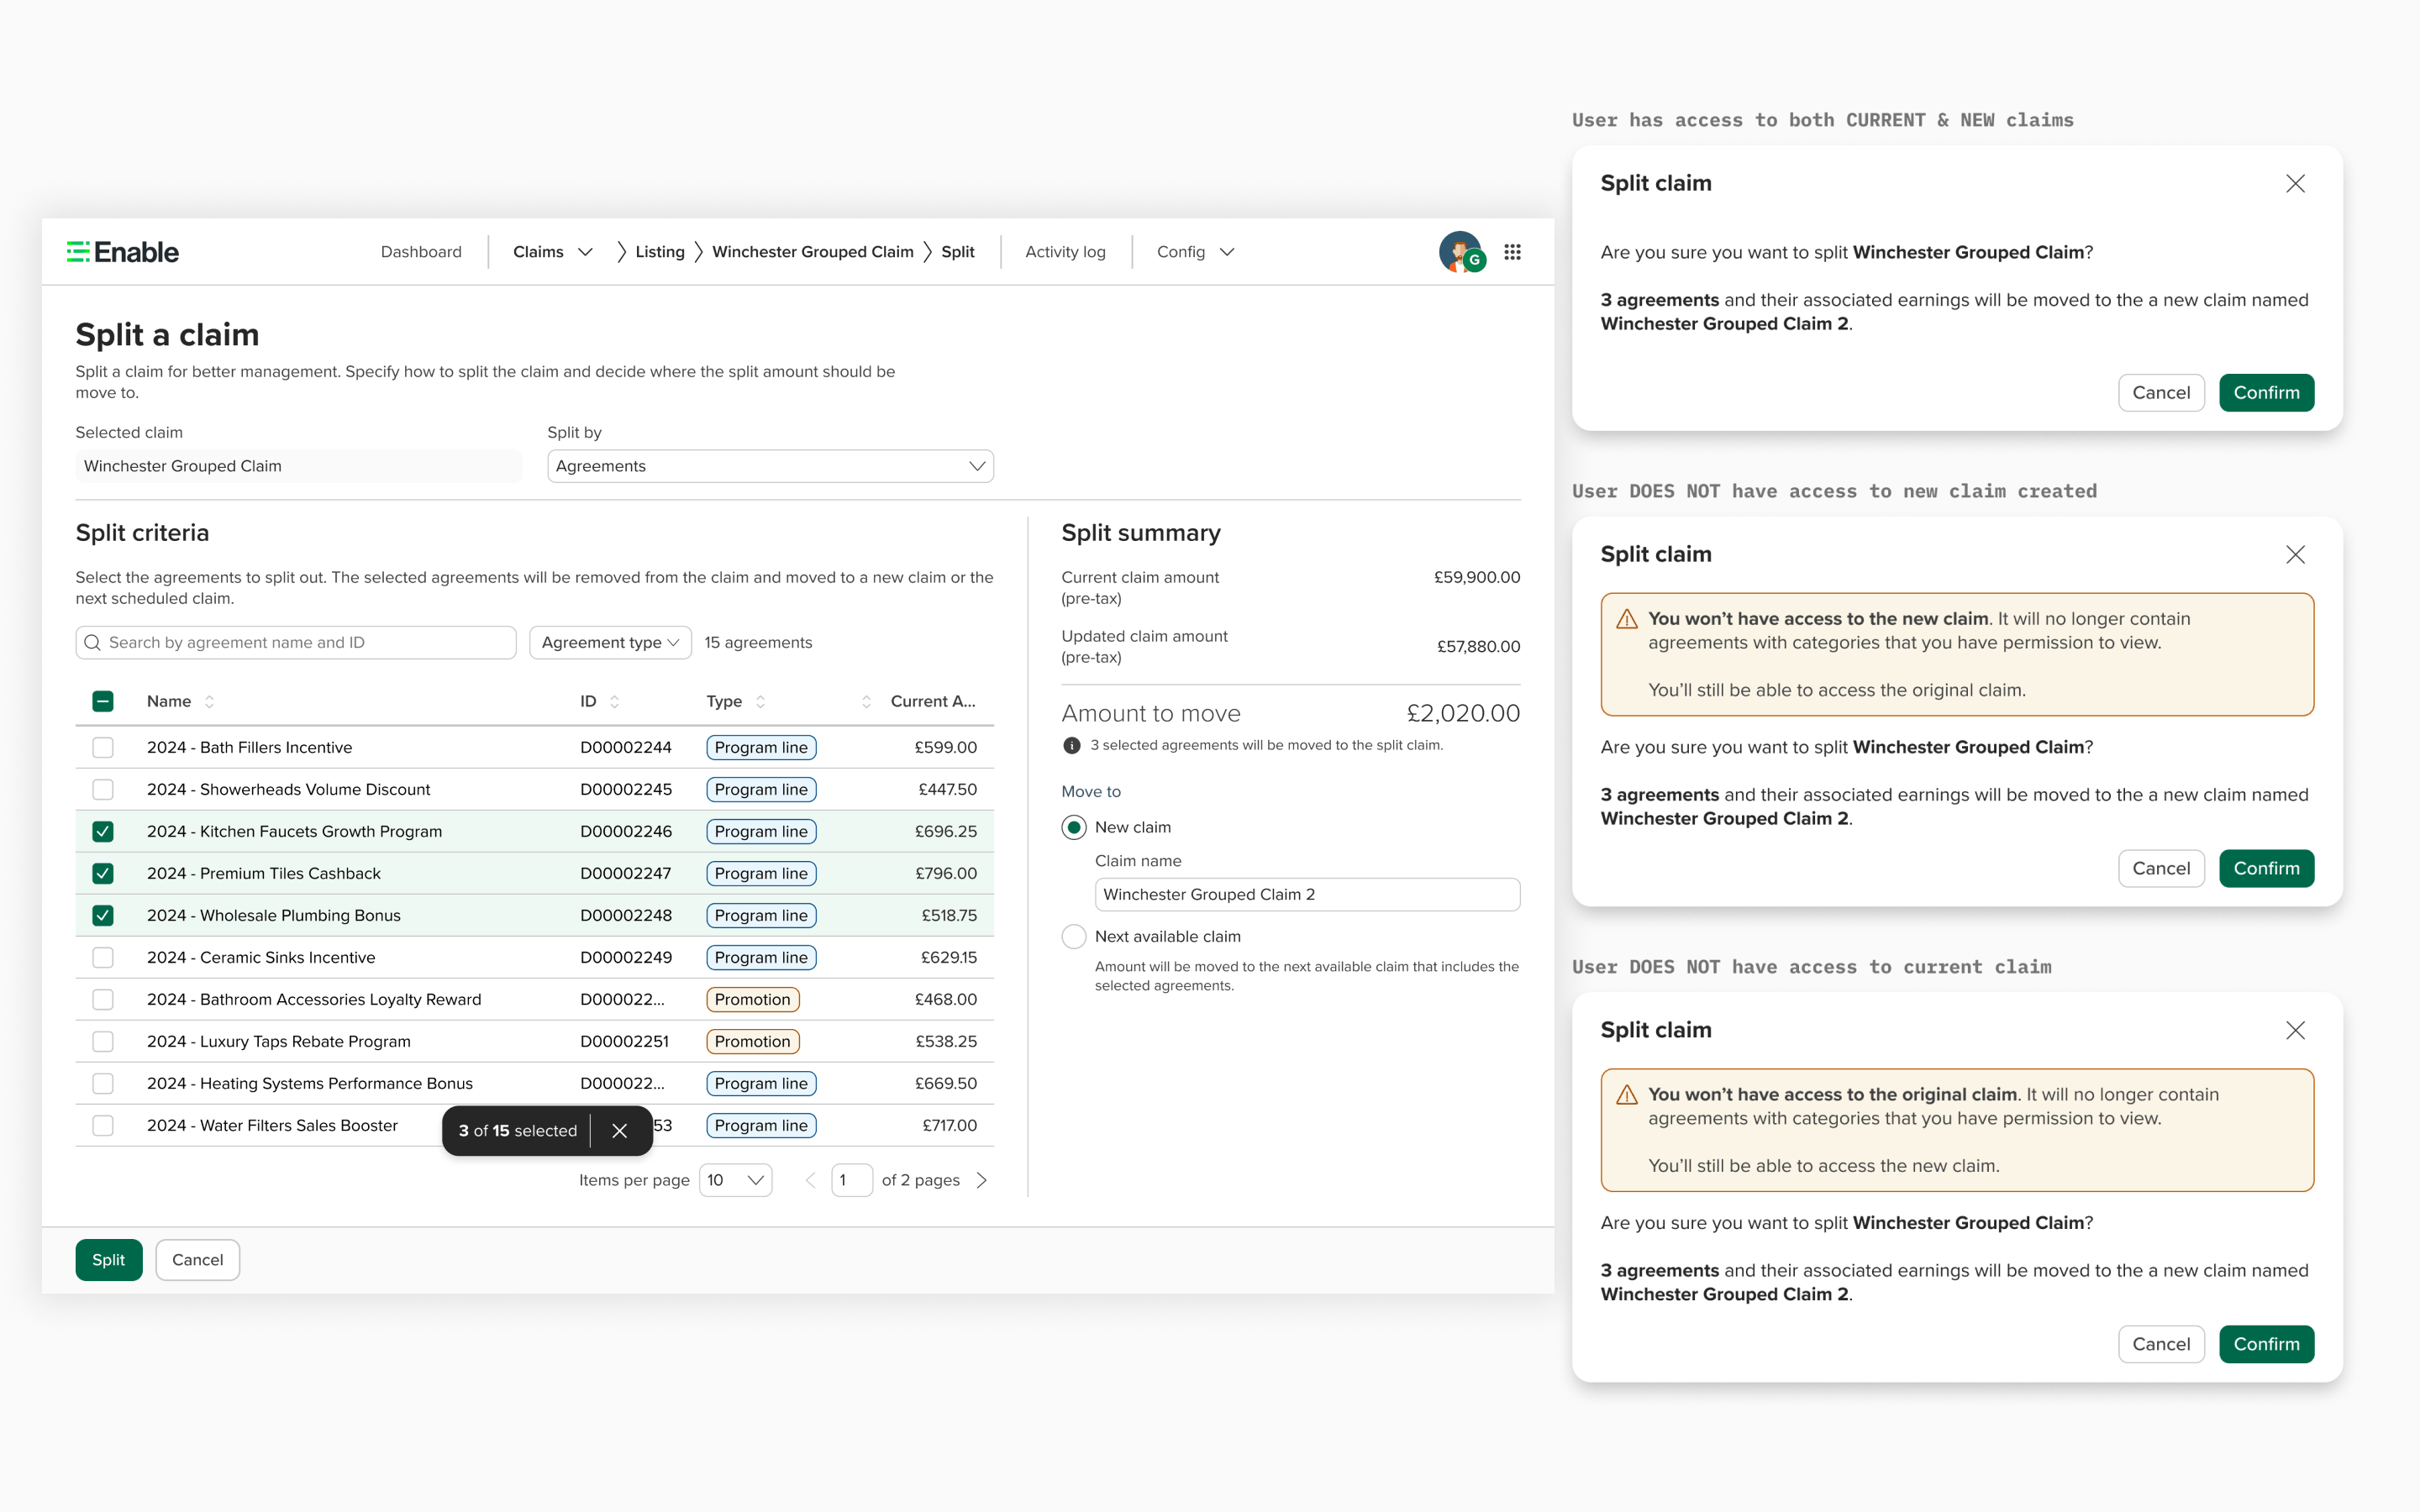
Split Validation
Split validation — real-time inline error prevention
Splitting can move agreements outside a user's access scope. Warning surfaces before they commit, not after.
08 · Post-Launch Validation

Measuring the shift

Quantitative Signals

📉 Product Intake Tickets Dropped

Tickets shifted from "this is broken" → "can we add more of this?"

📈 Enterprise Pipeline Grew

Greencross ($128k) · HPS ($198k) · Vallen ($249k) · BWG Foods ($202k) — all entering onboarding.

🎯 Reconstructed Baseline

~8–12
manual split escalations/week
before launch
~0–1
after splitting
launched

Pieced together from analyst retrospective — not captured at launch time.

Customer Feedback

"The new Claims interface is so much cleaner. We can actually find what we need now."

— Customer, post-foundation launch

"Before, I'd export to Excel just to find one agreement. Now I just search."

— Ops team lead, enterprise customer

"The design system components look really polished. This feels like a different product."

— Internal stakeholder
08 · Post-Launch · Reflection

What I'd measure differently

The Gap We Didn't Anticipate
📊

We shipped analytics. We had no baseline.

Before splitting existed, analysts handled splits manually. That volume was never measured in real time — we had to reconstruct it from memory after shipping.

Adoption data without context

30 splits/week: high or low? No pre-launch proxy. The number was uninterpretable.

What I'd Do Differently
1

Instrument a proxy before launch

Track analyst ticket volume for manual split requests — a baseline before launch.

2

Define success criteria with the PM pre-launch

Agree on what "good" looks like before shipping, not after.

A company-wide gap I've been pushing to close. Every launch needs a plan before shipping.
09 · Impact

From "nobody wants this"

to $3M+ ARR

$3M+
Annual recurring revenue from current Claims customers
$2M+
Incremental revenue unlocked through enterprise adoption
10+
Major features shipped in 9 months post-foundation redesign
Enterprise Pipeline (Active Onboarding)
Greencross ($128k) · HPS ($198k) · Vallen ($249k) · BWG Foods ($202k)
Org Impact
First design system adoption in production · 15–20 engineers now proactively contributing design ideas
Beyond Claims · Org-Wide Impact

Design maturity, from one product outward

🧩
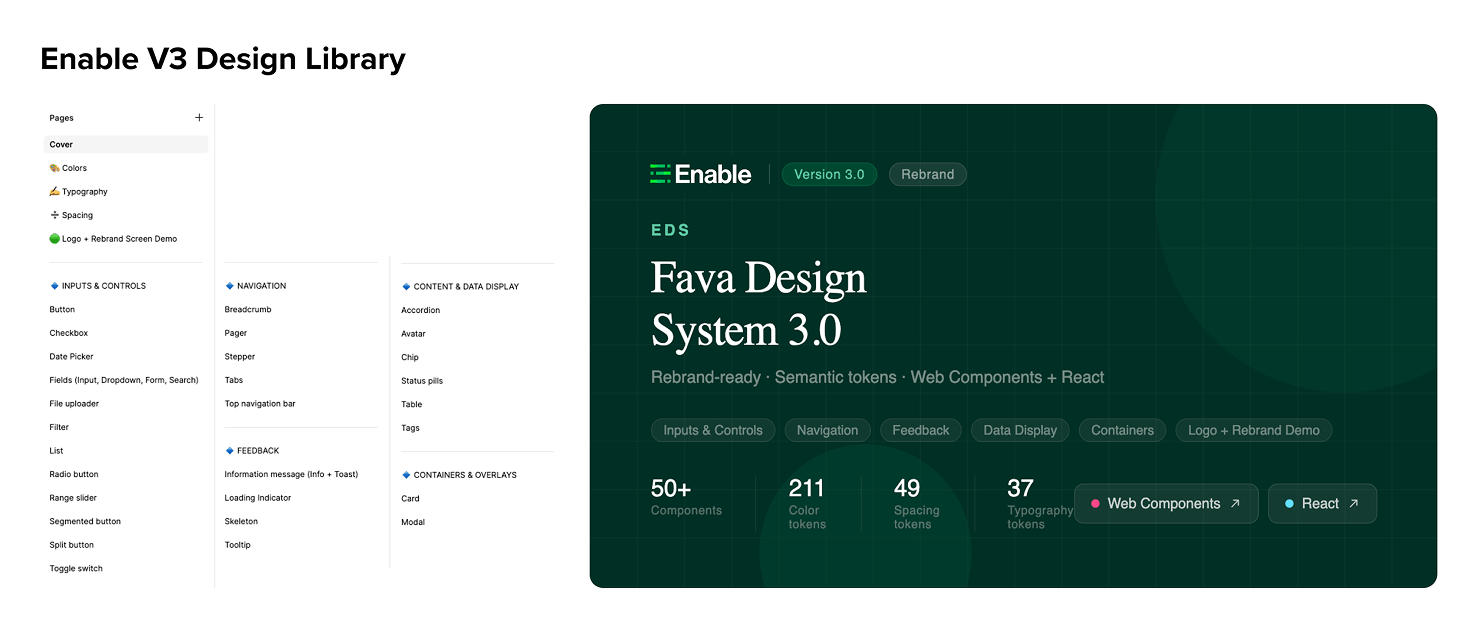
Enable Design System — Owner

V1 → V3 (Fava). 50+ components · 211 color tokens · Web Components + React.

🏁
Claims as the proving ground

First product to ship with the Enable Design System. Every team inherited a validated library.

Company-wide rebrand — Design lead

QA workflow, cross-team coordination — Storybook + live product shipped simultaneously.

10 · Reflection

What I learned

1

Foundation before features

3 slow months made 9 fast ones possible.

2

Domain depth is non-negotiable in B2B

The first month of research paid dividends in every decision that followed.

3

Measure before you ship, not after

Shipping without a baseline isn't measurement.

4

Culture change unlocks ideas you'd never have alone

Linked claims came from an engineer — built in a 2-day hackathon. That doesn't happen without showing up consistently.

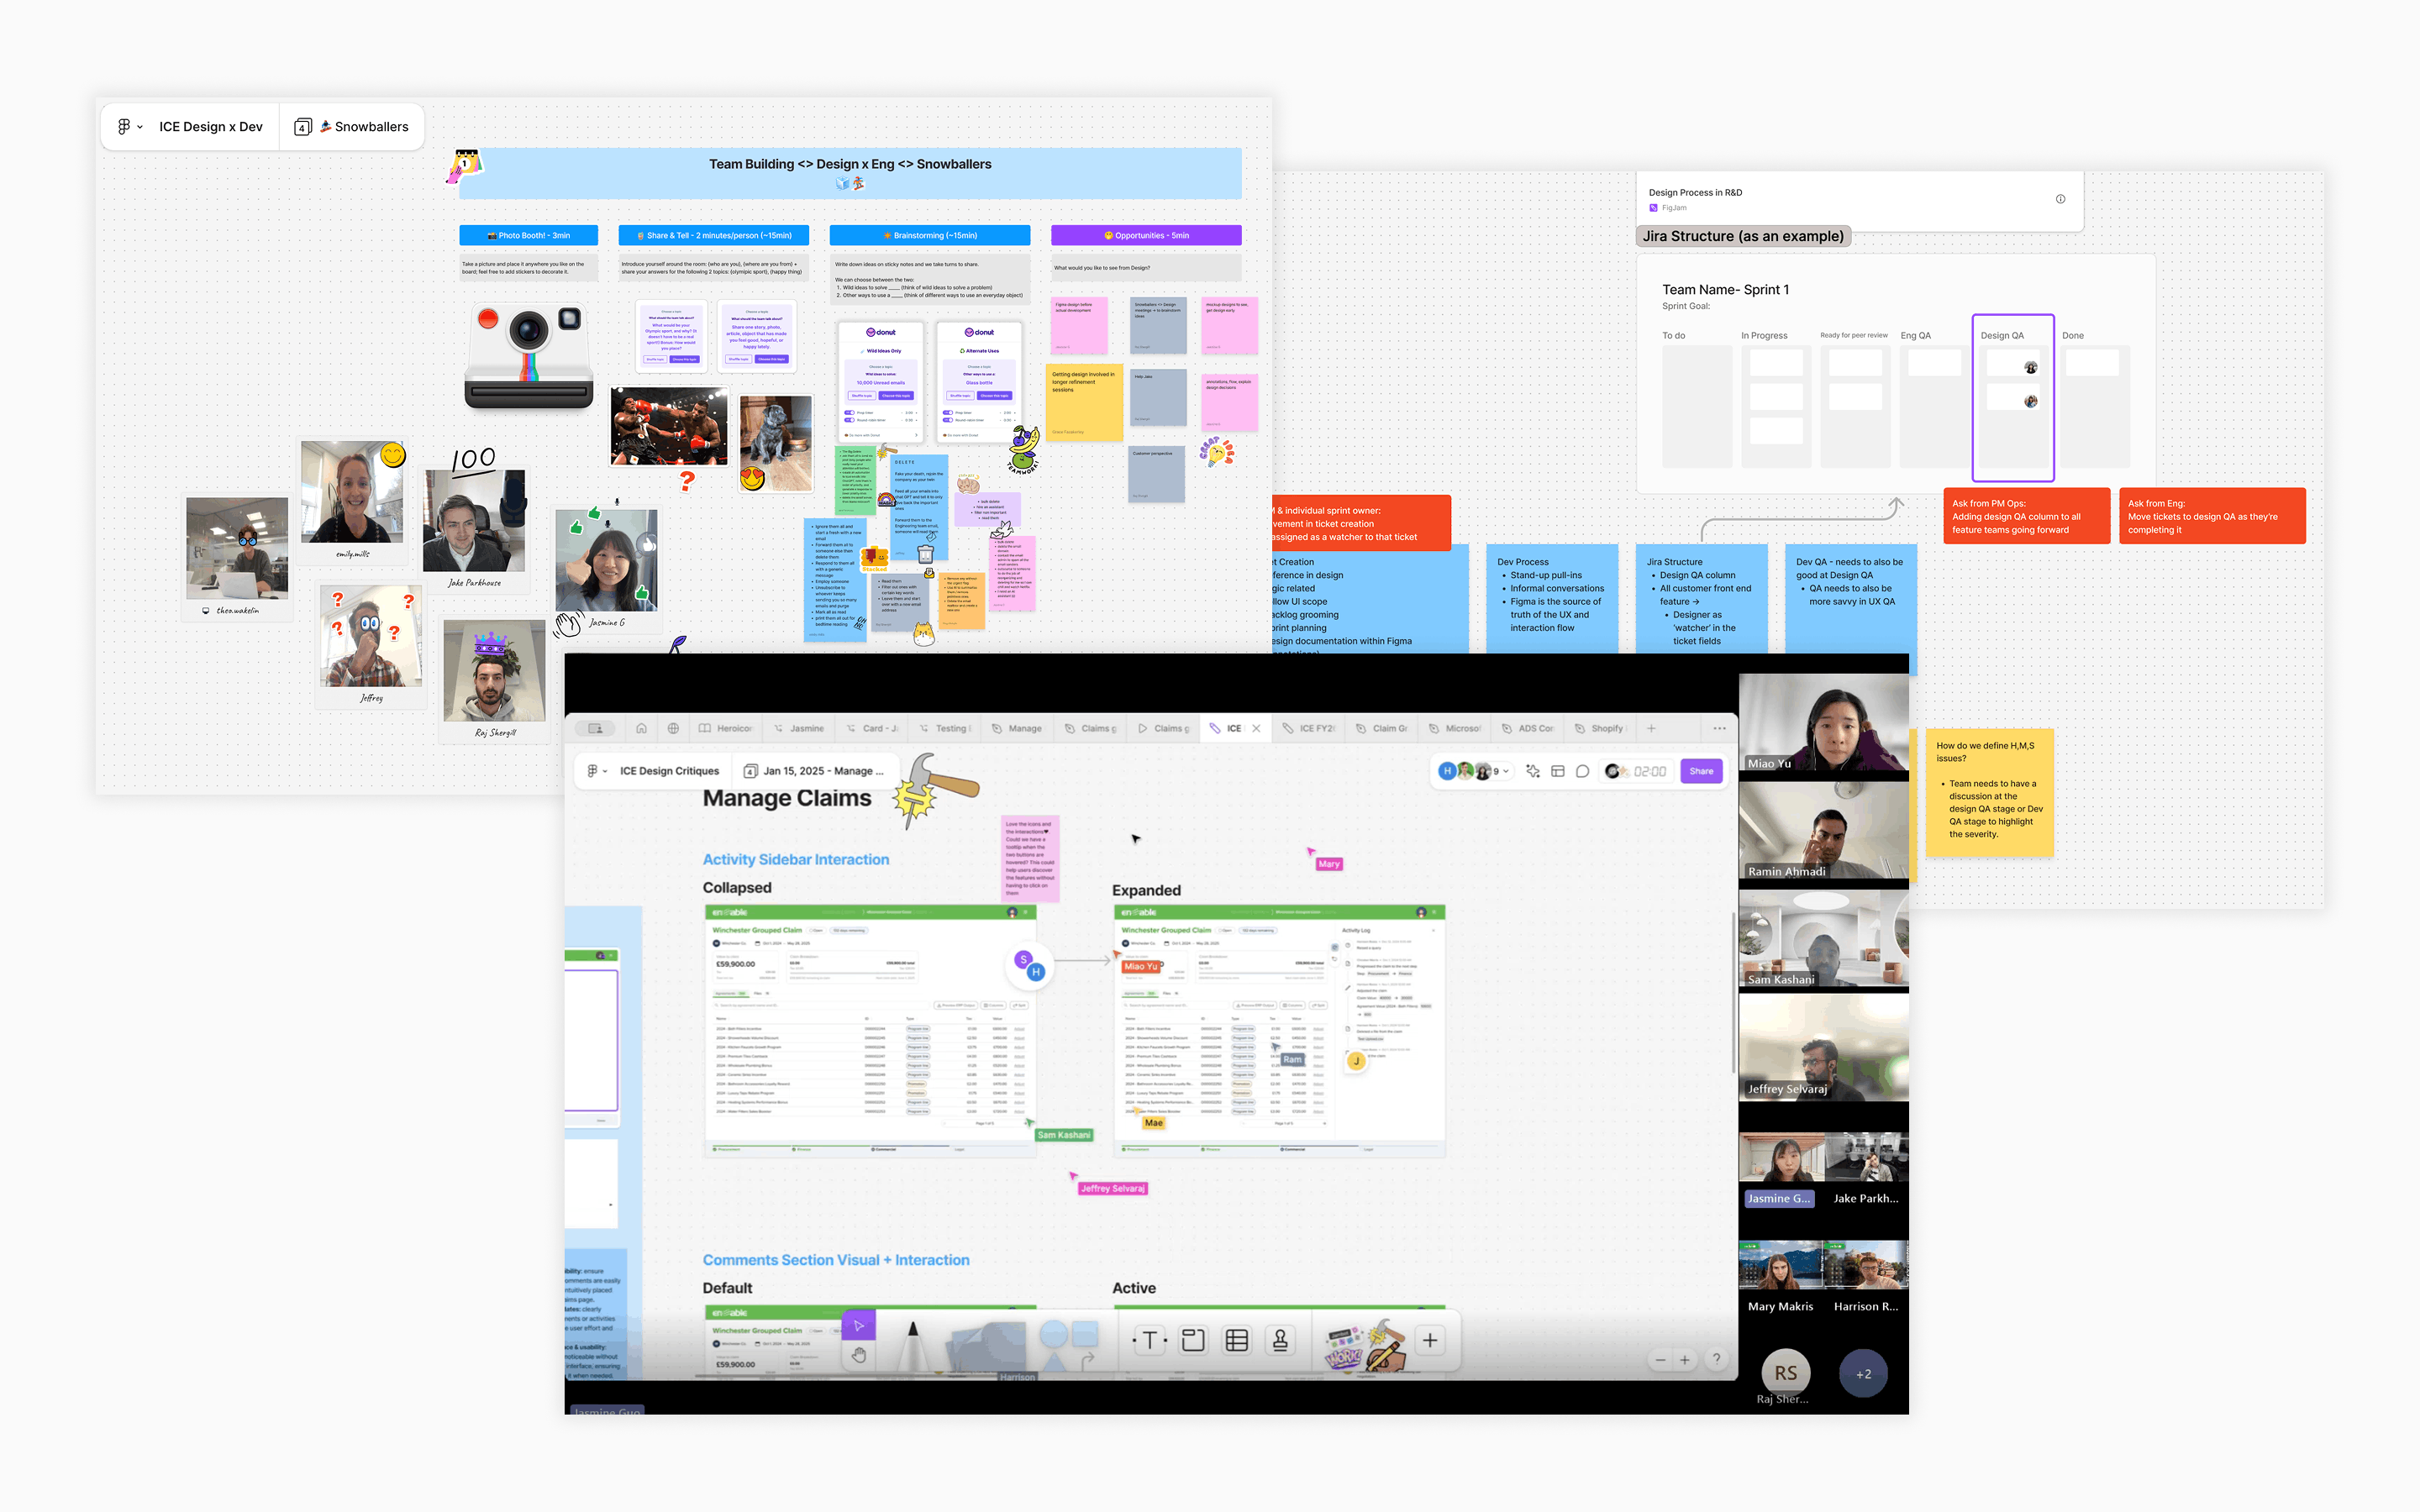
Team collaboration
Enable Claims · Kehui (Jasmine) Guo

Thank you~

Any questions?

Email
jasmineguokehui@gmail.com
LinkedIn
linkedin.com/in/kehui-guo
Portfolio
kehuiguo.xyz, love99